A finished product can hide a long journey from the ground. Metals and minerals pass through extraction, processing and transport before they become buildings, devices and industrial equipment. Mining companies operate near the beginning of that journey.
This ranking compares one hundred listed businesses in the source’s mining category. The amounts are market capitalisations, capturing the value of their equity. They are not estimates of the total market price of all the material that might someday be extracted from their projects.
An ore body is not a finished product
A mineral deposit needs engineering, investment and time before it can produce something saleable. Grades, recovery rates, infrastructure and operating conditions all matter. That makes a simple multiplication of estimated resources by a commodity price a poor substitute for understanding the company that develops them.
Diversification changes the comparison
A company exposed to one metal has a different mix of business risks from a group producing several commodities. Some businesses are developing projects, while others operate producing mines. The broad category makes their scale comparable without making their operations equivalent.
Equity value follows more than a commodity chart
Commodity prices are part of the story, alongside costs, financing, ownership and expectations about future production. Country labels in the table describe the source’s company classification. They should not be read as a complete map of the mines or projects a group owns around the world.
What this snapshot shows
BHP Group leads this captured list at approximately US$221.49bn. The entry at number 100, PT Bumi Resources Minerals Tbk, is approximately US$5.44bn. The first ten account for 42.5% of the sum of the hundred reported values. That share is calculated within this list; it is not a share of the entire economy.
The first ten
BHP Group
Listing symbol: BHP ·
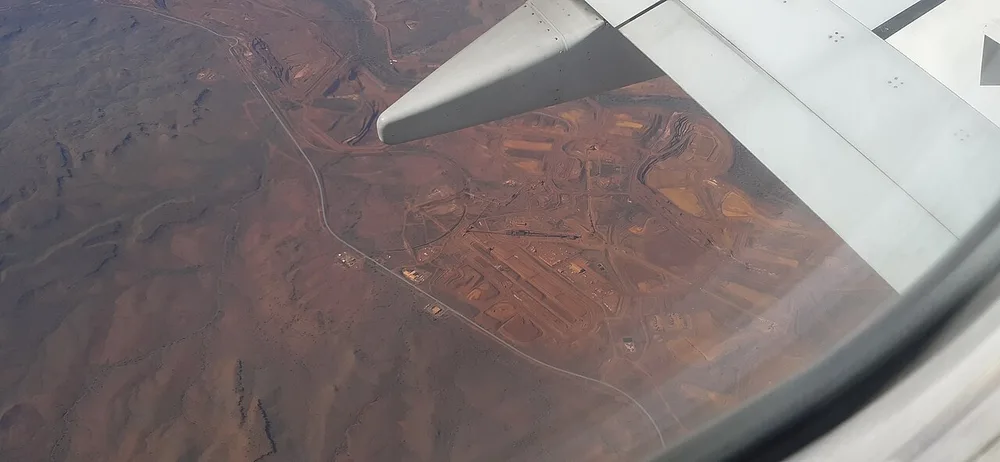
BHP’s origins lie in Broken Hill, Australia, and its development has taken it into large-scale mining operations supplying major industrial commodities. Iron ore and copper connect its business to steelmaking, electrical equipment and infrastructure.
The mines are only part of what has to work: processing, rail connections, ports and long-term development decisions help turn a resource into a saleable product. Its market capitalisation concerns the company’s equity, not a simple multiplication of underground tonnes by today’s commodity price.
Southern Copper
Listing symbol: SCCO ·
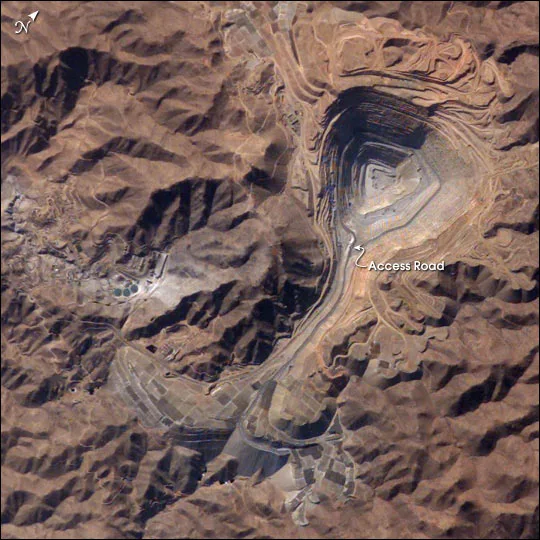
Southern Copper operates mines and related processing facilities in Peru and Mexico. Copper is central to the business, with other metals recovered alongside it. The Toquepala and Cuajone operations help make the company’s industrial scale visible.
Grupo México holds a controlling interest, so the two names in this ranking are not entirely independent exposures to mining. Each listed company has its own equity valuation; adding their market capitalisations together would not produce a clean measure of distinct underlying assets.
Rio Tinto
Listing symbol: RIO ·
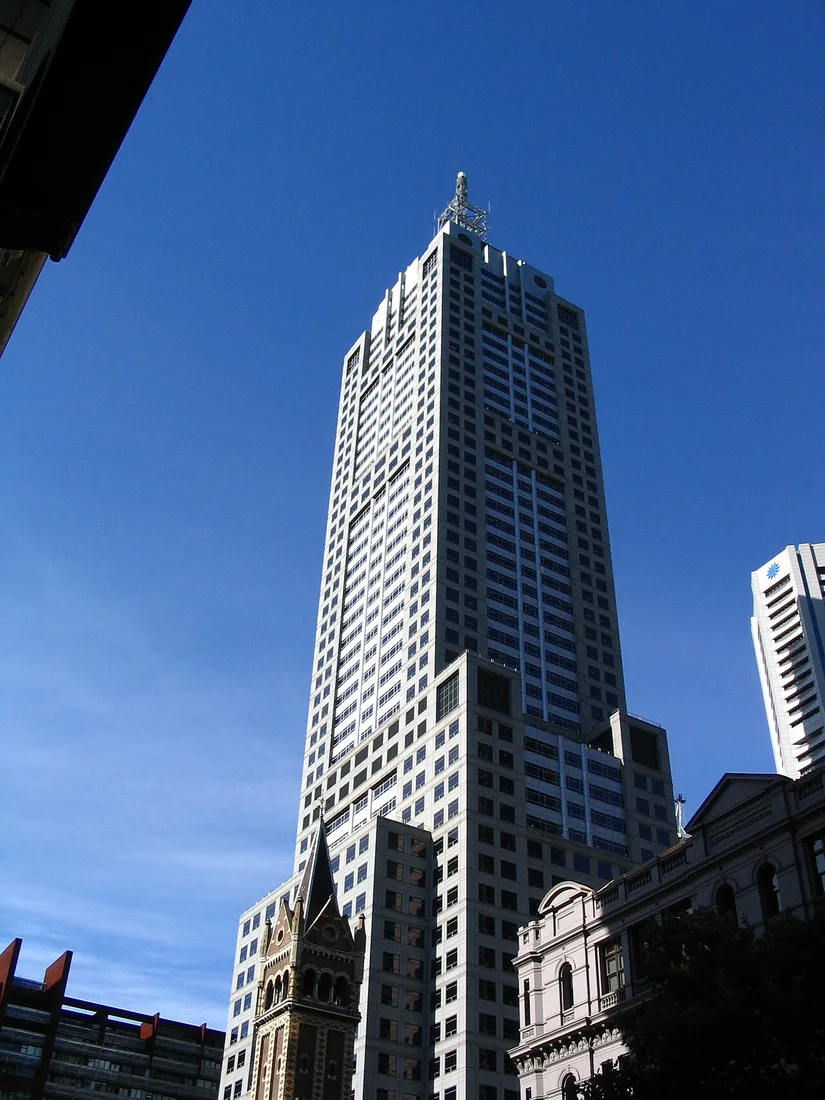
Rio Tinto takes its name from mining operations in Spain, but its modern business spans several countries and major commodities. Iron ore, aluminium and copper connect it with construction, transport, manufacturing and electricity systems.
The variety of resources means the group does not depend on the economics of one metal alone. Its Anglo-Australian corporate structure also makes the source’s treatment of listings important: this ranking follows the supplied company-level value rather than treating each trading line as a separate mining business.
China Shenhua Energy
Listing symbol: 601088.SS ·
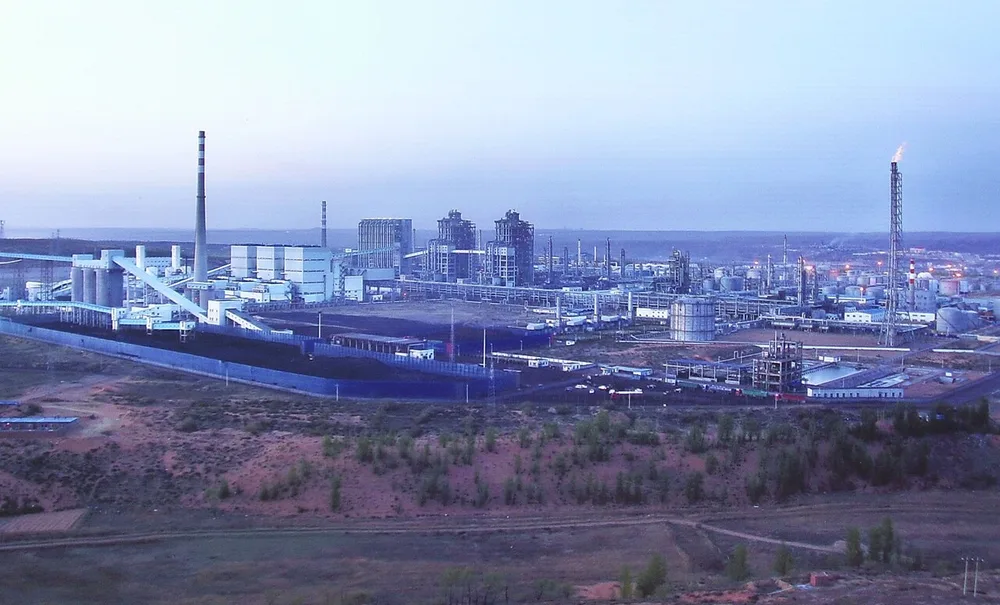
China Shenhua Energy combines coal mining with transport and electricity generation. Railways and port facilities help move output from mines to users, while power generation connects another stage of the energy chain to the same business.
That integration distinguishes it from a company whose main activity is extracting and selling one mineral. Its inclusion reflects the ranking source’s mining-sector coverage; the equity value represents a wider operating system, including infrastructure needed to move and use the resource.
Newmont
Listing symbol: NEM ·
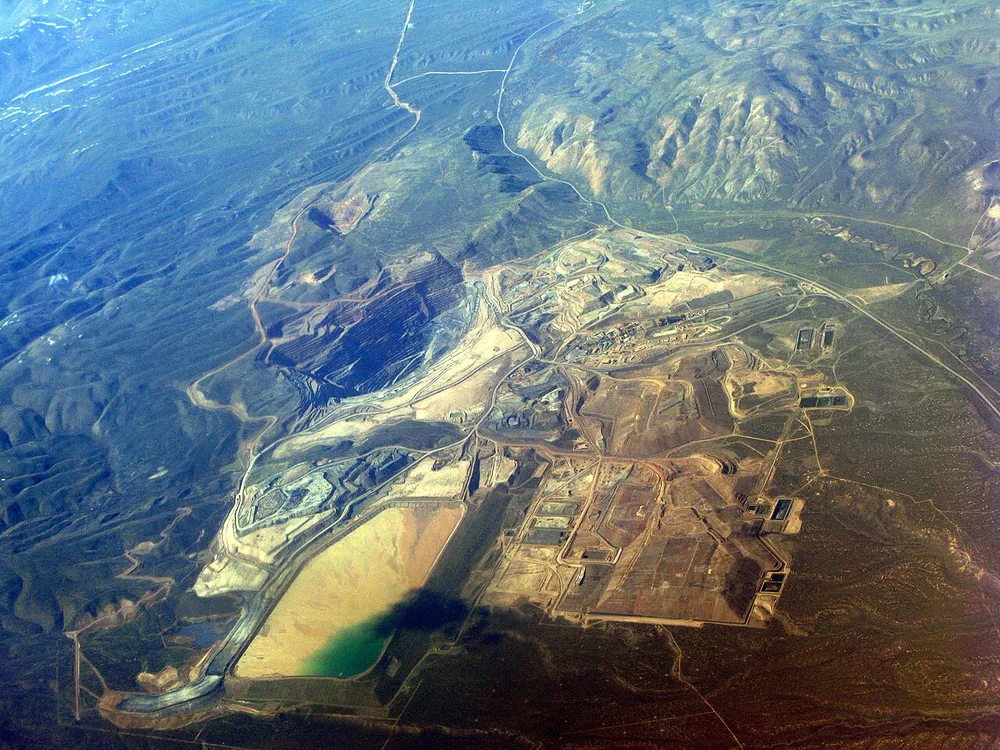
Newmont is a gold producer with operations across several regions and a corporate history reaching back to 1921. Its mines also produce other metals, but gold remains the central connection most readers make with the company.
A mining share is different from holding bullion. Operating costs, project development, financing and the performance of individual mines all sit between the metal price and the company’s results. The market value therefore reflects an operating enterprise, not simply ownership of a fixed quantity of gold.
Zijin Mining
Listing symbol: 601899.SS ·
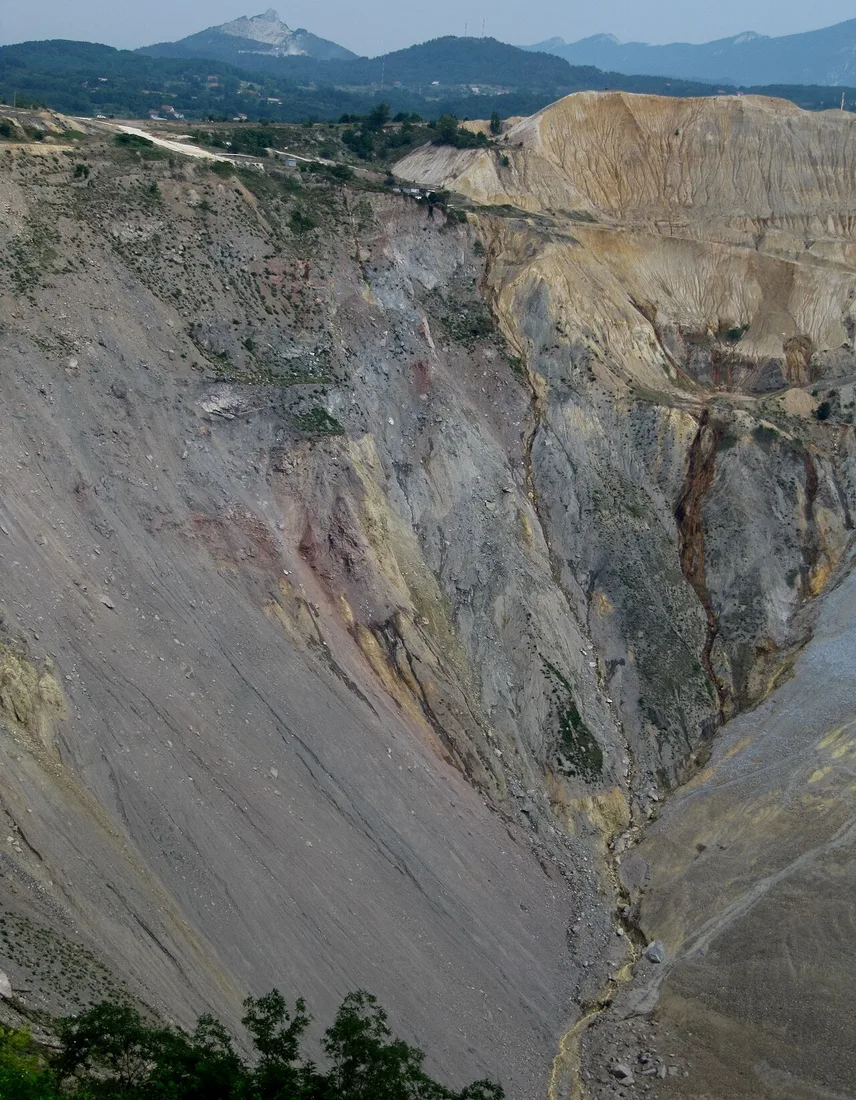
Zijin Mining grew from a Chinese mining business into a group with operations across several continents. Gold, copper and zinc are important parts of its resource portfolio, linking it to both precious-metal demand and industrial production.
Its international development brings together deposits, processing facilities and partnerships in different settings. The listed company’s value concerns those operating interests as a whole; neither one mine photograph nor the price of one commodity captures the full business.
Freeport-McMoRan
Listing symbol: FCX ·
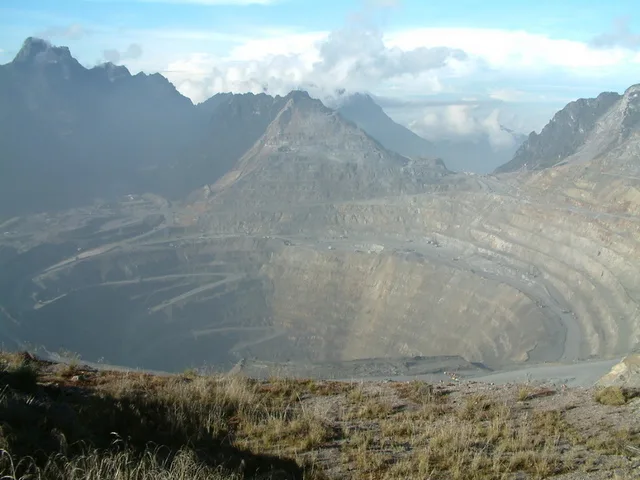
Freeport-McMoRan is closely associated with copper, alongside production of gold and molybdenum. Its interests include the Grasberg minerals district in Indonesia, a striking example of the scale and complexity involved in developing a major resource operation.
Different metals can emerge from the same mining system, so the company cannot be understood by looking at one commodity in isolation. Its equity value also reflects ownership arrangements, capital requirements and operating performance, not simply the visible size of a mine.
Agnico Eagle Mines
Listing symbol: AEM ·
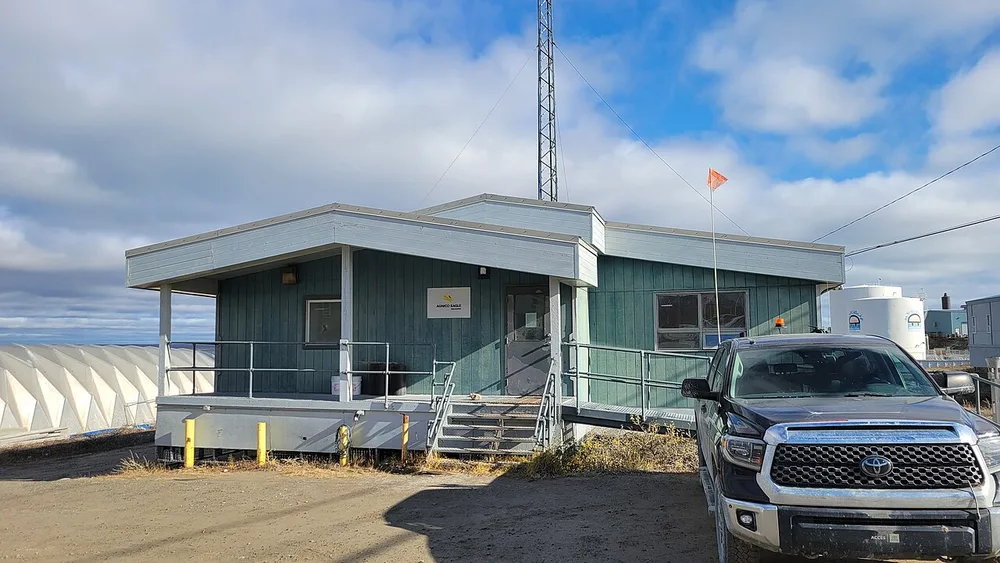
Agnico Eagle is a Canadian gold producer with operations that include Canada, Finland, Australia and Mexico. Its business involves developing and running mines over many years, with exploration and project decisions shaping what can follow existing production.
The company’s place in the ranking is therefore about more than a response to the daily gold price. The durability of operations, the cost of producing metal and the resources needed for future development all form part of the enterprise shareholders are valuing.
Grupo México
Listing symbol: GMBXF ·
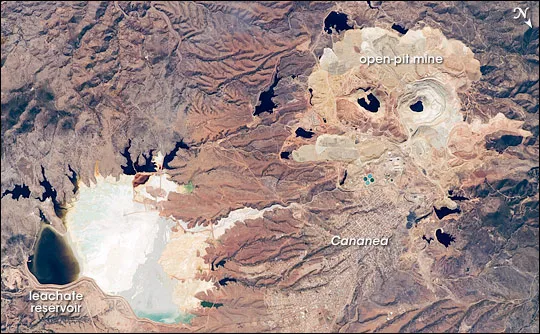
Grupo México combines mining with transport and infrastructure businesses. Copper is a major connection through its mining interests, including a controlling stake in Southern Copper, while rail operations give the group another role in moving industrial output.
The presence of both parent and subsidiary in a market-value list requires care when interpreting totals. These are separate quoted equity values, but their underlying interests overlap; they should not be added together as if every mine and business were unrelated.
Glencore
Listing symbol: GLCNF ·
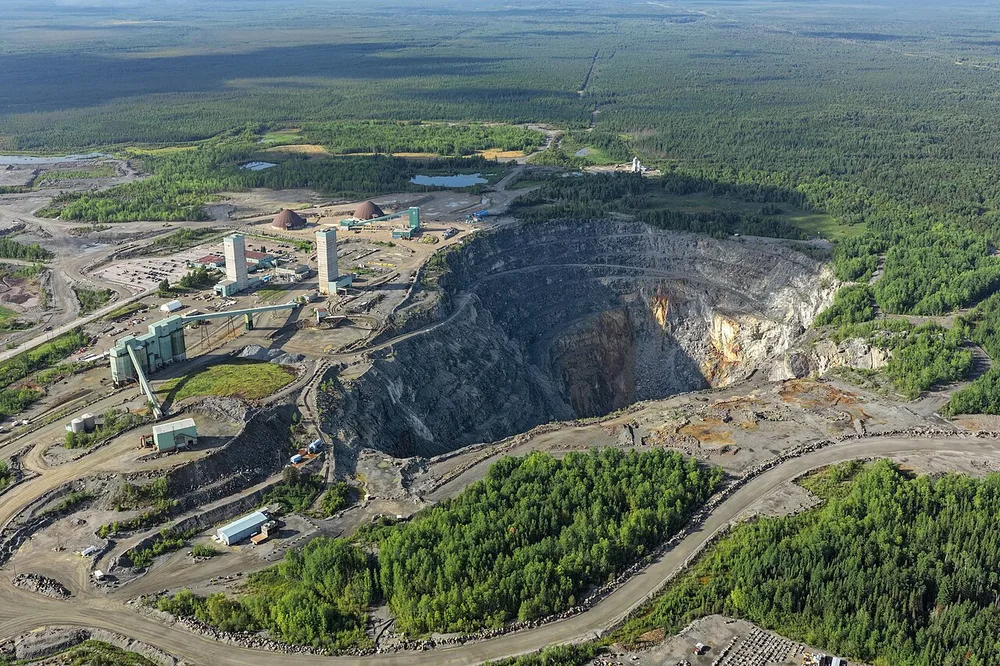
Glencore combines the production of commodities with a large marketing and trading business. Mines and other industrial assets supply one side of the story, while sourcing, transporting and selling materials across markets forms another.
That combination makes it different from a producer focused mainly on output from its own mines. The company’s value includes commercial networks and operating capabilities as well as physical assets, connecting the location where a resource is produced with the customer who needs it.
The ranking continues: 11–100
CompaniesMarketCap · ranking and methodology
- Market capitalisation: US$71,892,230,144.00
- Market capitalisation: US$69,995,134,976.00
- Market capitalisation: US$68,219,632,776.00
- Market capitalisation: US$64,815,263,744.00
- Market capitalisation: US$57,834,429,941.00
- Market capitalisation: US$54,635,884,724.00
- Market capitalisation: US$52,812,423,168.00
- Market capitalisation: US$51,304,431,616.00
- Market capitalisation: US$50,545,127,131.00
- Market capitalisation: US$43,647,940,010.00
- Market capitalisation: US$42,107,330,560.00
- Market capitalisation: US$40,179,429,376.00
- Market capitalisation: US$37,437,128,704.00
- Market capitalisation: US$36,837,969,666.00
- Market capitalisation: US$34,555,191,296.00
- Market capitalisation: US$32,595,464,192.00
- Market capitalisation: US$31,988,891,838.00
- Market capitalisation: US$29,512,587,264.00
- Market capitalisation: US$29,164,938,358.00
- Market capitalisation: US$27,504,576,800.00
- Market capitalisation: US$26,439,564,817.00
- Market capitalisation: US$24,954,447,403.00
- Market capitalisation: US$23,643,451,750.00
- Market capitalisation: US$23,382,181,486.00
- Market capitalisation: US$22,579,268,905.00
- Market capitalisation: US$21,375,143,936.00
- Market capitalisation: US$21,232,381,890.00
- Market capitalisation: US$21,154,902,016.00
- Market capitalisation: US$20,871,868,416.00
- Market capitalisation: US$20,543,799,813.00
- Market capitalisation: US$20,540,864,564.00
- Market capitalisation: US$20,233,657,188.00
- Market capitalisation: US$19,988,885,530.00
- Market capitalisation: US$18,888,785,699.00
- Market capitalisation: US$17,934,394,086.00
- Market capitalisation: US$17,756,492,311.00
- Market capitalisation: US$17,121,455,204.00
- Market capitalisation: US$17,021,333,607.00
- Market capitalisation: US$16,568,872,514.00
- Market capitalisation: US$16,221,126,183.00
- Market capitalisation: US$16,177,999,919.00
- Market capitalisation: US$16,146,384,015.00
- Market capitalisation: US$16,108,254,020.00
- Market capitalisation: US$15,036,272,640.00
- Market capitalisation: US$14,857,130,927.00
- Market capitalisation: US$14,734,112,111.00
- Market capitalisation: US$14,612,735,929.00
- Market capitalisation: US$14,476,502,016.00
- Market capitalisation: US$13,491,067,963.00
- Market capitalisation: US$13,387,253,800.00
- Market capitalisation: US$13,376,884,606.00
- Market capitalisation: US$13,287,580,672.00
- Market capitalisation: US$13,169,339,122.00
- Market capitalisation: US$12,899,533,824.00
- Market capitalisation: US$12,597,701,427.00
- Market capitalisation: US$11,984,116,325.00
- Market capitalisation: US$11,778,719,744.00
- Market capitalisation: US$11,568,459,776.00
- Market capitalisation: US$11,115,998,819.00
- Market capitalisation: US$10,777,645,470.00
- Market capitalisation: US$10,465,283,251.00
- Market capitalisation: US$10,380,708,630.00
- Market capitalisation: US$10,196,613,857.00
- Market capitalisation: US$9,641,248,768.00
- Market capitalisation: US$9,621,035,516.00
- Market capitalisation: US$9,552,490,347.00
- Market capitalisation: US$9,484,090,073.00
- Market capitalisation: US$9,071,064,064.00
- Market capitalisation: US$8,995,910,656.00
- Market capitalisation: US$8,652,471,870.00
- Market capitalisation: US$8,459,883,731.00
- Market capitalisation: US$8,229,675,118.00
- Market capitalisation: US$7,918,486,544.00
- Market capitalisation: US$7,582,643,401.00
- Market capitalisation: US$7,300,512,256.00
- Market capitalisation: US$7,287,516,327.00
- Market capitalisation: US$7,107,360,768.00
- Market capitalisation: US$7,044,579,523.00
- Market capitalisation: US$6,958,781,952.00
- Market capitalisation: US$6,755,475,968.00
- Market capitalisation: US$6,718,175,791.00
- Market capitalisation: US$6,604,485,632.00
- Market capitalisation: US$6,451,120,364.00
- Market capitalisation: US$6,422,906,892.00
- Market capitalisation: US$6,105,585,605.00
- Market capitalisation: US$5,904,233,244.00
- Market capitalisation: US$5,894,733,702.00
- Market capitalisation: US$5,583,945,638.00
- Market capitalisation: US$5,435,887,071.00
There is always a story.
The raw-material economy is both physical and financial. These hundred listed values provide a view of its corporate scale, while the projects and operating businesses behind the shares explain why mineral wealth cannot be reduced to a price per tonne.