The digital world still needs physical things: chips, machines, networks and devices. It also needs software and services that make those things useful. A technology ranking puts those layers together, showing how markets value different parts of a system that people encounter every day.
This list uses the technology category defined by the source. It ranks one hundred public companies by market capitalisation at capture, with a company record beside every amount. It is broad enough to invite comparisons while keeping the classification visible.
A platform and a factory have different economics
A service that distributes software and a manufacturer that builds hardware can both sit in a technology list. One may require relatively little additional physical production to serve another customer; the other may depend on expensive equipment and complex supply chains. Their market values compress those different business models into one number.
Expectations are part of the price
A market value reflects what investors are prepared to pay for equity, including expectations about future business. It is not the amount already earned from a promising product. A new computing trend can change expectations quickly, while revenue and cash flow take longer to reveal what customers actually bought.
Category boundaries are editorial choices
Technology runs through retail, cars, payments and media. Different providers draw the boundary differently. A company’s absence from this list does not mean it lacks technical capability. Keeping one provider’s category avoids quietly mixing several incompatible definitions into a supposedly precise top hundred.
What this snapshot shows
NVIDIA leads this captured list at approximately US$5.27tn. The entry at number 100, Nanya Technology, is approximately US$48.35bn. The first ten account for 61.9% of the sum of the hundred reported values. That share is calculated within this list; it is not a share of the entire economy.
The first ten
NVIDIA
Listing symbol: NVDA ·
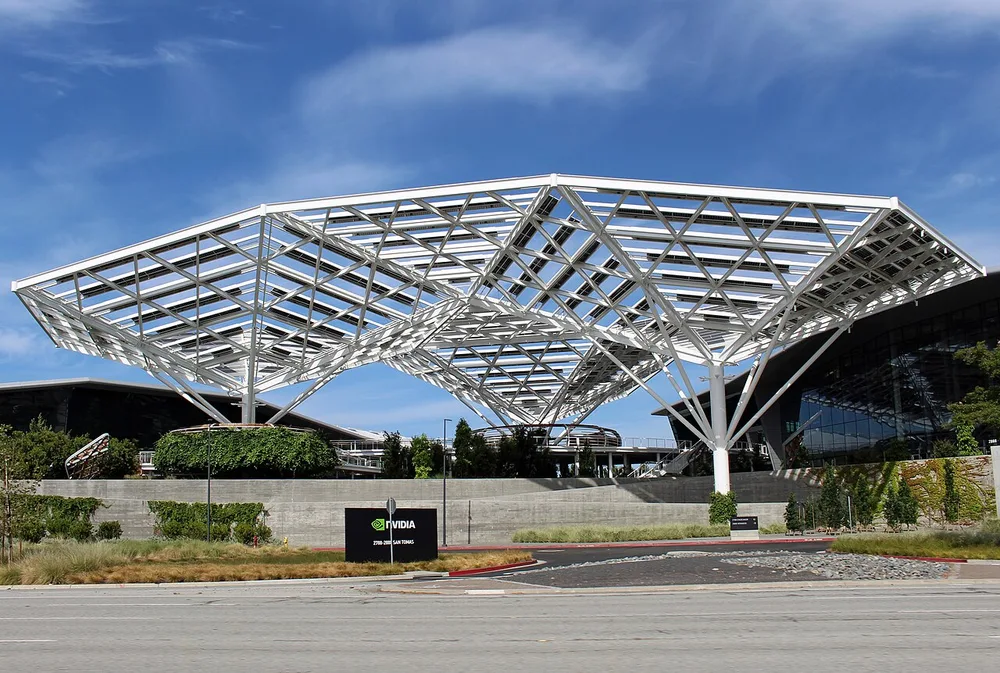
NVIDIA made its name by supplying the graphics processors that draw game worlds. The same ability to perform many calculations in parallel opened a much larger role in scientific computing and artificial intelligence. Its business now connects chips, networking, complete computing systems and the software used to work with them.
The striking part of its position is that much of this technology sits inside another organisation’s infrastructure. A consumer may never buy an NVIDIA-branded device yet still use services running on its processors.
Apple
Listing symbol: AAPL ·
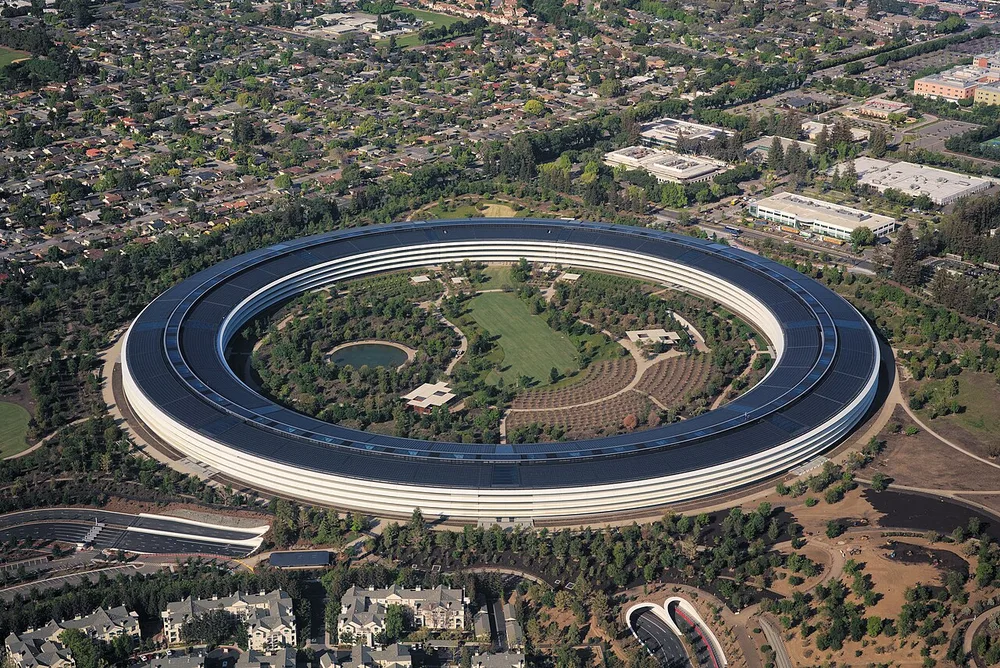
Apple combines hardware, operating systems and services in products intended to work together. The iPhone is its most recognisable example, but Macs, iPads, watches and the services surrounding them extend the relationship beyond a single purchase. The company’s origins in personal computing remain visible in that integration of product and software design.
Its market value prices the whole business, including expectations about future products and services. It is not the retail value of the devices already in customers’ pockets or on their desks.
Alphabet (Google)
Listing symbol: GOOG ·
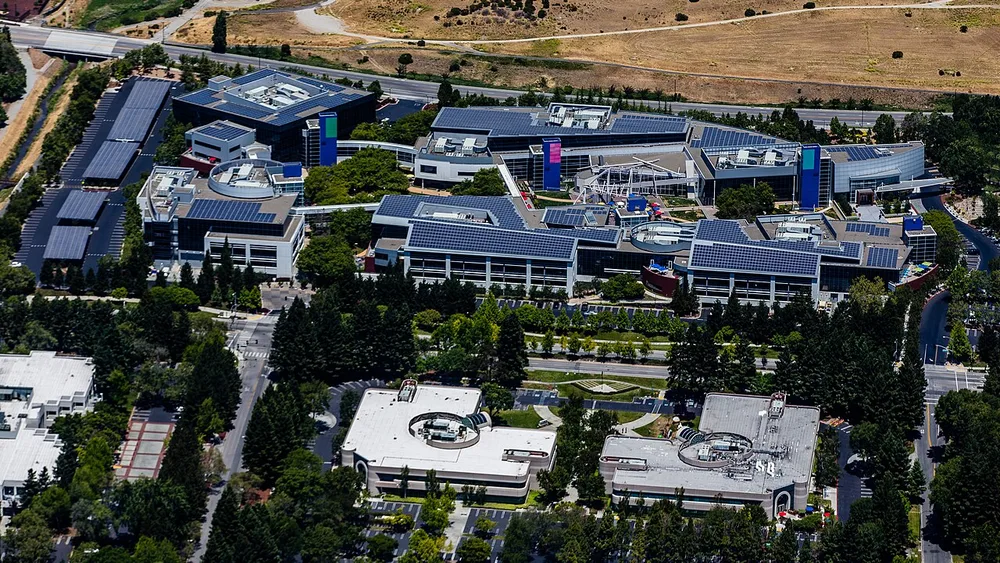
Alphabet was created in 2015 as the parent of Google and a wider collection of businesses. Search and advertising are central to its economic story, while YouTube, Android and cloud services give it several other routes into people’s working and everyday lives.
The listed parent is the unit being valued here. Google’s familiar name helps readers identify the company, but the number represents Alphabet’s equity as a whole, including activities that a user of the search engine may rarely encounter.
Microsoft
Listing symbol: MSFT ·
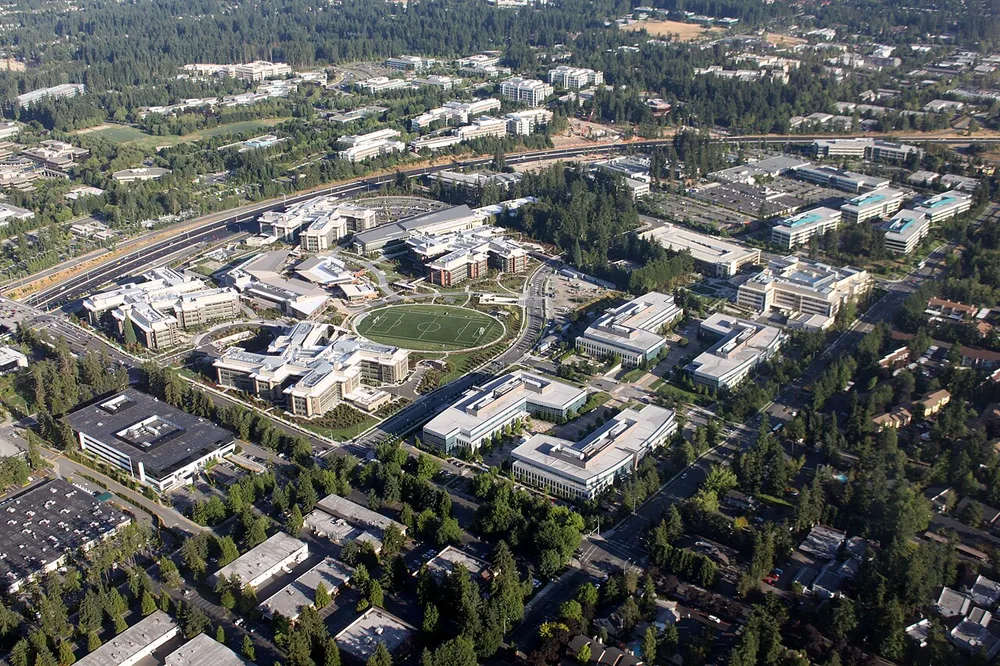
Microsoft’s history runs from software for early personal computers to the infrastructure of modern offices and data centres. Windows and Office made the brand familiar, while Azure, business applications, developer tools and gaming expanded its reach into other settings.
Its place in the ranking reflects that combination of established software relationships and newer computing demand. A company can buy Microsoft services throughout its organisation, from an employee’s desktop to the systems delivering its own products to customers.
Amazon
Listing symbol: AMZN ·

Amazon’s storefront is the most visible part of a business that also supplies cloud computing, advertising, entertainment and logistics. The online bookseller founded in 1994 grew into a marketplace where outside merchants sell alongside Amazon’s own retail operations.
Amazon Web Services adds a different kind of customer relationship: organisations pay for computing infrastructure rather than physical products. That combination is why a retail-sector appearance should not be mistaken for a valuation of the shopping website alone.
TSMC
Listing symbol: TSM ·

TSMC manufactures semiconductors for other companies. Its foundry model lets customers design chips while relying on a specialist manufacturer to turn those designs into physical devices. The precision, factories and process development required make this a very different business from selling a branded phone or computer.
Its position reveals an important link between apparently separate technology companies. Competing products can depend on the same manufacturer, and demand for advanced computing reaches TSMC through the designs its customers ask it to build.
SpaceX
Listing symbol: SPCX ·
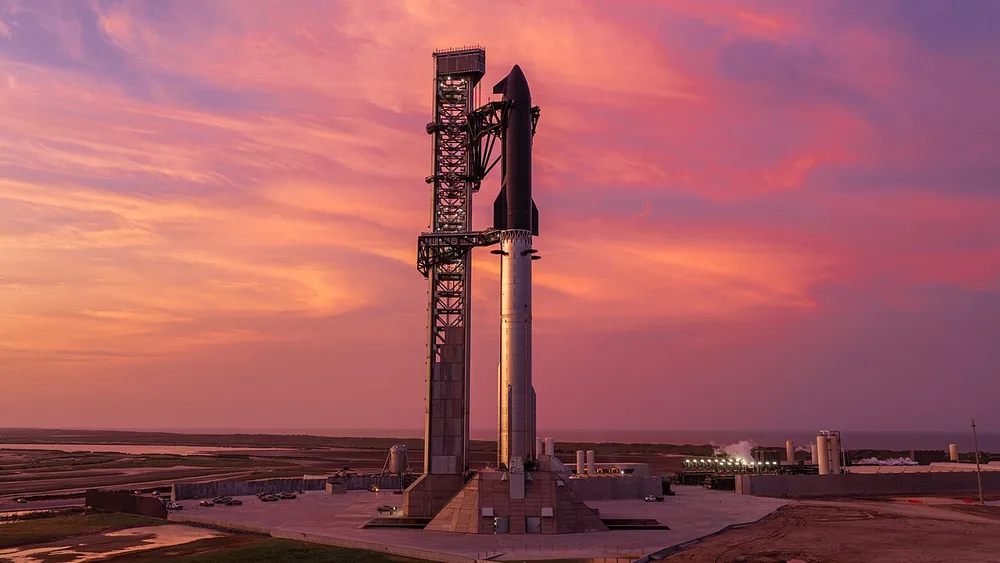
SpaceX connects launch vehicles, spacecraft and satellite communications in one enterprise. Falcon rockets and Dragon spacecraft made reusable launch operations and transport to orbit central parts of its identity, while Starlink created a communications business supported by a large satellite network.
The hardware is dramatic, but the underlying businesses are different: launching a customer’s payload and providing a broadband connection create distinct revenue relationships. The source’s market-capitalisation figure values the listed company as a whole, rather than one rocket programme or satellite constellation.
Broadcom
Listing symbol: AVGO ·

Broadcom supplies semiconductors and infrastructure software used inside networks, data centres, storage systems and connected devices. Its products often work behind more recognisable consumer or enterprise brands, moving data or supporting the systems that organisations rely on.
The acquisition of VMware added a substantial software business to that mix. Broadcom’s appearance alongside device makers therefore represents a different part of the technology economy: components and infrastructure that help other companies deliver their own products and services.
Meta Platforms (Facebook)
Listing symbol: META ·
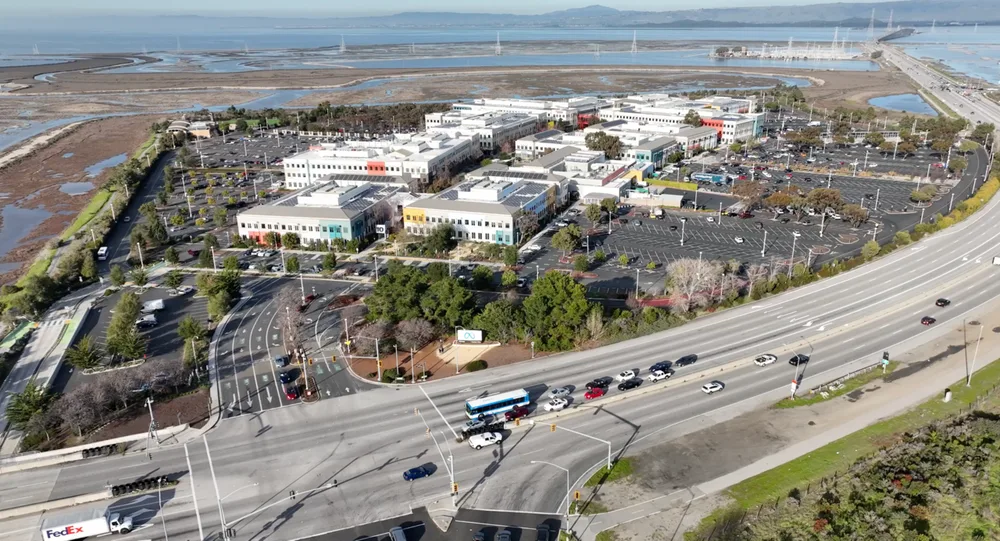
Meta brings Facebook, Instagram, WhatsApp and other communication services under one parent. The company’s advertising business links the attention of users with organisations trying to reach them. Those services differ in format, but their scale gives the group several ways to build and maintain an audience.
Its spending on artificial intelligence and immersive computing sits alongside that established business. The valuation belongs to the parent company, so the ranking does not assign a separate market price to each individual app.
Tesla
Listing symbol: TSLA ·
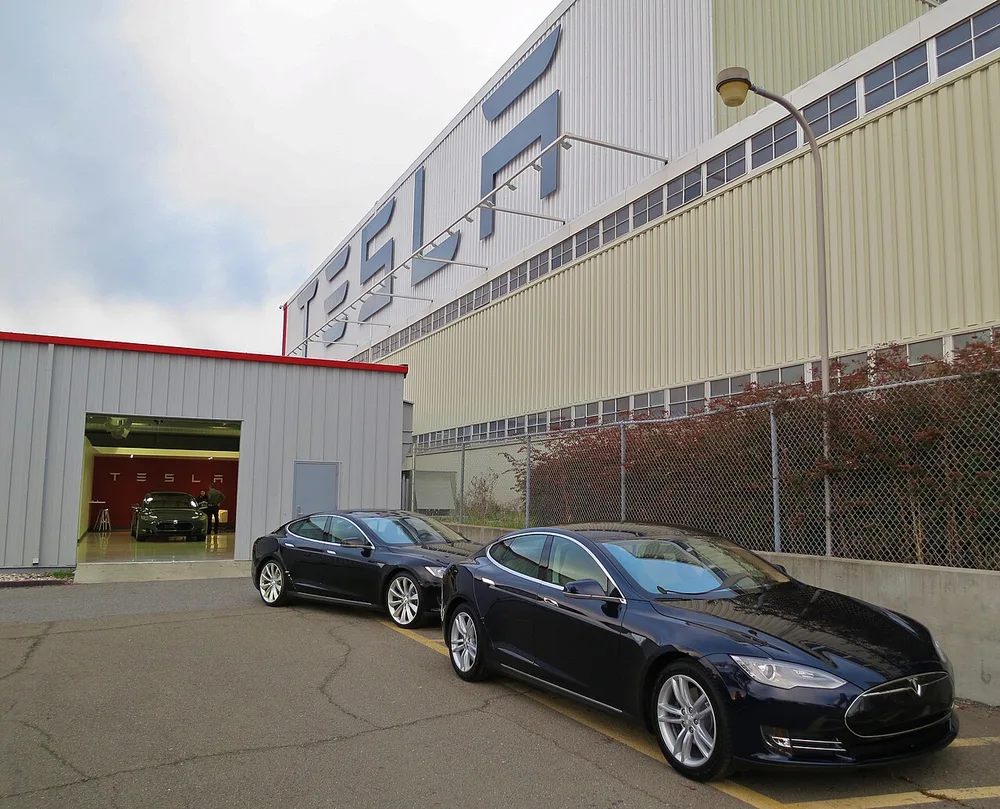
Tesla combines electric vehicles with batteries, charging and energy-storage products. The cars make the brand immediately recognisable, but home and grid-scale storage connect it to a different set of energy customers. Software and manufacturing are part of both sides of the business.
Its placement in a technology ranking follows the source’s sector definition. The market value still concerns the full listed company, whose activities cross the usual boundaries between automotive production, electrical equipment and software.
The ranking continues: 11–100
CompaniesMarketCap · ranking and methodology
- Market capitalisation: US$1,271,014,042,238.00
- Market capitalisation: US$1,101,452,017,664.00
- Market capitalisation: US$959,406,437,562.00
- Market capitalisation: US$842,569,351,168.00
- Market capitalisation: US$652,317,032,448.00
- Market capitalisation: US$599,925,050,899.00
- Market capitalisation: US$544,151,666,688.00
- Market capitalisation: US$492,750,150,000.00
- Market capitalisation: US$442,082,263,040.00
- Market capitalisation: US$432,877,174,784.00
- Market capitalisation: US$401,863,442,432.00
- Market capitalisation: US$373,168,930,816.00
- Market capitalisation: US$362,269,278,208.00
- Market capitalisation: US$360,690,188,288.00
- Market capitalisation: US$322,288,943,104.00
- Market capitalisation: US$282,795,343,872.00
- Market capitalisation: US$271,678,668,800.00
- Market capitalisation: US$269,479,739,392.00
- Market capitalisation: US$251,727,839,232.00
- Market capitalisation: US$245,389,656,064.00
- Market capitalisation: US$239,153,479,680.00
- Market capitalisation: US$238,181,597,184.00
- Market capitalisation: US$236,014,616,576.00
- Market capitalisation: US$231,777,582,595.00
- Market capitalisation: US$229,211,865,088.00
- Market capitalisation: US$212,184,170,496.00
- Market capitalisation: US$211,688,292,352.00
- Market capitalisation: US$203,873,566,720.00
- Market capitalisation: US$194,354,970,624.00
- Market capitalisation: US$192,394,098,540.00
- Market capitalisation: US$190,268,905,616.00
- Market capitalisation: US$188,774,842,368.00
- Market capitalisation: US$183,543,709,696.00
- Market capitalisation: US$167,124,926,464.00
- Market capitalisation: US$152,120,067,565.00
- Market capitalisation: US$149,079,073,121.00
- Market capitalisation: US$146,390,286,336.00
- Market capitalisation: US$139,628,412,928.00
- Market capitalisation: US$137,017,729,024.00
- Market capitalisation: US$133,186,279,921.00
- Market capitalisation: US$130,680,094,720.00
- Market capitalisation: US$119,935,386,390.00
- Market capitalisation: US$116,067,672,064.00
- Market capitalisation: US$114,510,700,544.00
- Market capitalisation: US$110,754,480,128.00
- Market capitalisation: US$109,982,432,546.00
- Market capitalisation: US$109,149,110,272.00
- Market capitalisation: US$108,830,965,760.00
- Market capitalisation: US$108,085,895,168.00
- Market capitalisation: US$106,569,711,616.00
- Market capitalisation: US$102,766,673,920.00
- Market capitalisation: US$102,393,577,472.00
- Market capitalisation: US$101,907,333,120.00
- Market capitalisation: US$101,209,694,208.00
- Market capitalisation: US$100,261,421,056.00
- Market capitalisation: US$99,881,328,756.00
- Market capitalisation: US$97,665,637,172.00
- Market capitalisation: US$96,190,586,880.00
- Market capitalisation: US$88,291,799,210.00
- Market capitalisation: US$87,504,519,168.00
- Market capitalisation: US$86,716,532,665.00
- Market capitalisation: US$86,441,869,312.00
- Market capitalisation: US$85,935,079,424.00
- Market capitalisation: US$83,154,591,744.00
- Market capitalisation: US$82,422,292,480.00
- Market capitalisation: US$79,690,465,280.00
- Market capitalisation: US$79,430,983,680.00
- Market capitalisation: US$76,152,569,856.00
- Market capitalisation: US$74,019,323,904.00
- Market capitalisation: US$68,945,098,564.00
- Market capitalisation: US$68,706,612,052.00
- Market capitalisation: US$65,070,358,528.00
- Market capitalisation: US$63,811,539,211.00
- Market capitalisation: US$62,312,914,944.00
- Market capitalisation: US$61,517,057,672.00
- Market capitalisation: US$61,365,223,424.00
- Market capitalisation: US$61,045,092,352.00
- Market capitalisation: US$60,665,065,472.00
- Market capitalisation: US$59,801,288,704.00
- Market capitalisation: US$59,667,087,360.00
- Market capitalisation: US$57,651,683,328.00
- Market capitalisation: US$56,779,051,008.00
- Market capitalisation: US$54,513,631,232.00
- Market capitalisation: US$53,555,737,824.00
- Market capitalisation: US$52,031,979,520.00
- Market capitalisation: US$50,725,138,904.00
- Market capitalisation: US$50,522,333,184.00
- Market capitalisation: US$49,507,915,353.00
- Market capitalisation: US$49,081,237,504.00
- Market capitalisation: US$48,350,169,802.00
There is always a story.
The technology economy stretches from difficult manufacturing to services delivered through a screen. This ranking puts a price on the equity of one hundred participants, while their different roles explain why similar market values can conceal very different businesses.