GDP per capita divides everything an economy produces in a year by the number of people who live there. On that measure Liechtenstein and Luxembourg lead, followed by Ireland, Switzerland, Norway and Singapore. The United States, at number 8, is the largest economy in the first ten.
The figures are the IMF’s projections for 2026, published in its World Economic Outlook in October 2026 and converted into US dollars at market exchange rates. The IMF gives 2026 figures for 191 economies; this list ranks the first hundred, including territories such as Hong Kong, Macao and Puerto Rico.
What is the richest country in the world by GDP per capita?
Liechtenstein, with a projected GDP per capita of US$230,417 for 2026, according to the IMF’s World Economic Outlook as captured on 15 October 2026.
Output is not income
GDP measures production inside an economy’s borders, not what its residents earn or own. Profits booked by foreign-owned companies count in GDP even when they flow abroad, and so does the work of commuters who live in a neighbouring country. Household income and wealth can therefore be far lower than the figure suggests.
Small populations, large numbers
Very small economies can reach extreme values. Liechtenstein, at the top, had about 42,000 inhabitants in the IMF’s data, and 25 of the hundred economies here had fewer than one million. In places that small, a single industry, bank or group of commuters can move the figure far more than in a large country.
The dollar matters
Converting each economy’s output into US dollars at market exchange rates makes the figures comparable but sensitive to currency movements. A stronger dollar lowers every other economy’s figure without any change in what it produces. Rankings adjusted for purchasing power, which allow for local prices, order countries differently.
What this snapshot shows
Liechtenstein leads this captured list at US$230,417 per person. The entry at number 100, Jamaica, is at US$8,674, so the leader’s figure is about 27 times as high. The median of the hundred values is about US$28,779. These are averages of output per person, not of what households earn.
The first ten
Liechtenstein
Population: 42 thousand ·

Liechtenstein has shared a customs union and currency with Switzerland since 1924. Within half a century, the mainly agricultural state became one of the world’s most industrialised countries. Low taxes and strict bank secrecy also drew in foreign funds.
Goods production, from engineering to dental technology, generated 40% of gross value added in 2023. In 2024, 58% of the workforce commuted from abroad, so the statistics office warns that GDP-per-head comparisons can mislead. IMF staff estimate that about a quarter of the pay from local employers goes to non-residents.
Luxembourg
Population: 696 thousand ·

Luxembourg was mainly rural until the mid-19th century; by the century’s end, steel was its dominant industry. A 1929 law on holding companies laid foundations for a financial centre. Finance later replaced steel as the main sector.
Finance, led by banks and investment funds, produced 30% of gross value added in 2024, Luxembourg for Finance says. STATEC reports that 47% of the 489,000 employees in 2024 were cross-border workers, mainly from France. Eurostat notes that they add to GDP but are not part of the resident population.
Ireland
Population: 5.6 million ·

In 1958, after decades of high tariffs, T. K. Whitaker’s official paper argued for free trade and foreign investment. Low taxes, state incentives and European market access then drew US firms such as Intel. Growth averaged 10% a year in 1995–2000.
The multinational sector produced 50.4% of value added in 2025, the Central Statistics Office (CSO) says. Eurostat notes that much of multinationals’ income from intellectual property and contract manufacturing goes to owners abroad. The CSO’s modified GNI, which excludes such effects, equalled 55.4% of GDP.
Switzerland
Population: 9.1 million ·

Zurich, Geneva and Basel led 19th-century Swiss industrialisation, notably in textiles, often using water power for lack of coal. Swiss factories came through the Second World War largely undamaged, and exports grew rapidly afterwards.
Chemicals and pharmaceuticals, made by firms such as Novartis and Roche, were 53% of exports in 2025, the customs office says. About 414,000 cross-border commuters worked in Switzerland in the second quarter of 2026. Eurostat put Swiss consumer price levels 71% above the EU average in 2025.
Norway
Population: 5.7 million ·
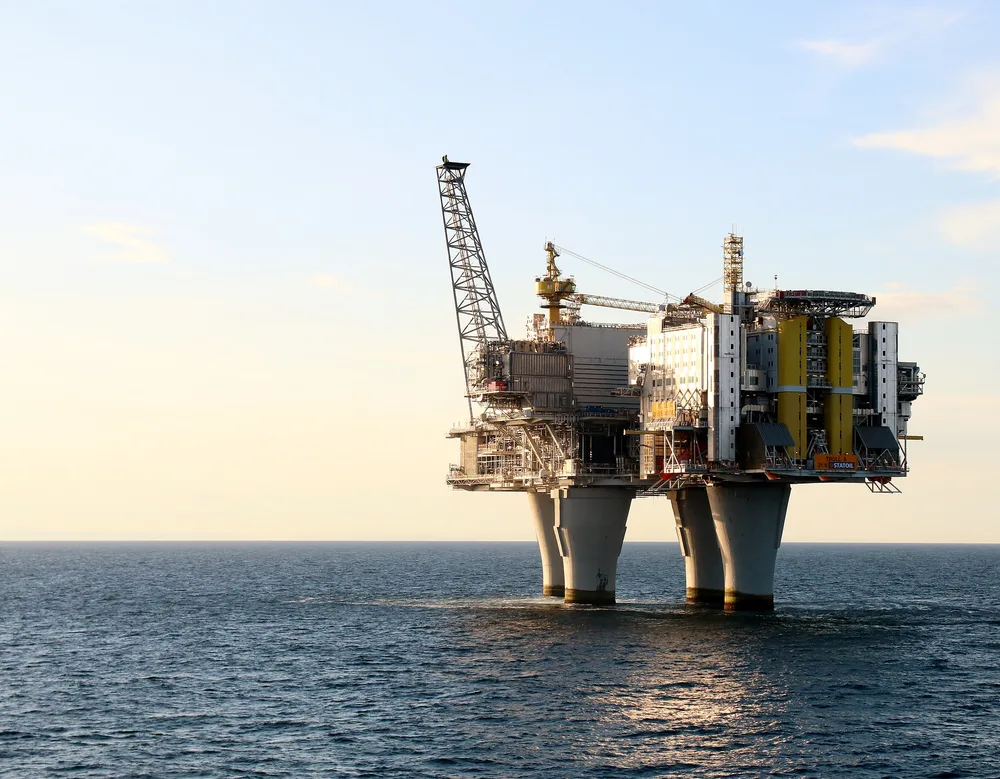
Large oil and gas reserves were found in the North Sea in 1969; production began in the early 1970s. The state founded Statoil, now Equinor, and taxes oil companies at a marginal rate of 78%.
Oil and gas remain the largest sector by value added, government revenue, investment and exports. Petroleum revenue goes into the Government Pension Fund Global, worth about NOK 21,300 billion at the end of 2025. Statistics Norway also publishes a Mainland GDP that excludes oil, gas and ocean transport.
Singapore
Population: 6.1 million ·
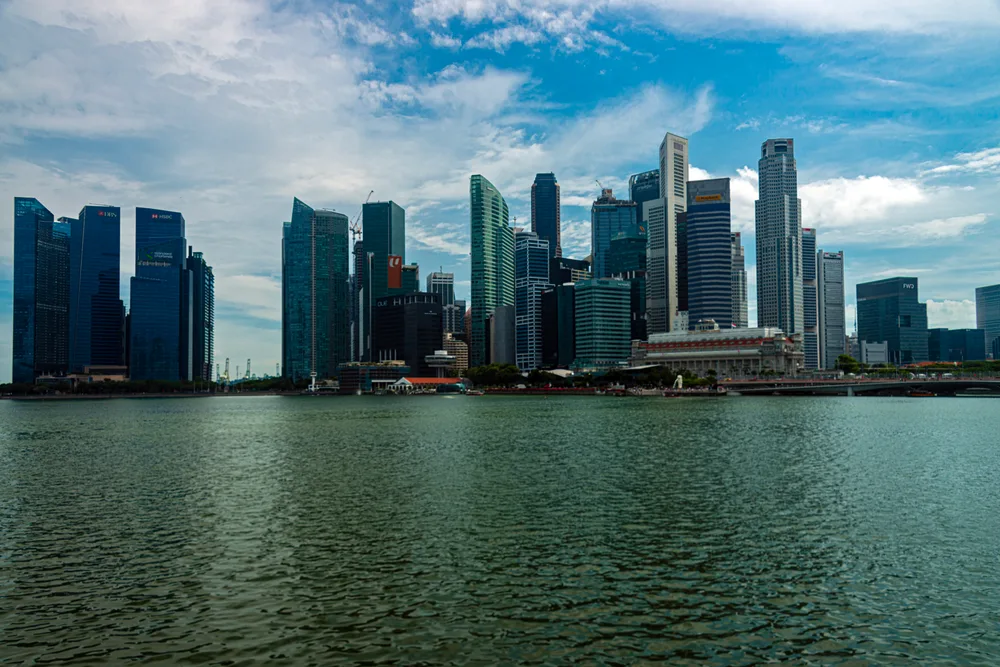
Singapore grew from a British trading post founded in 1819 beside the Strait of Malacca. After independence in 1965 it faced high unemployment; the Economic Development Board, created in 1961, courted foreign investors. By 2001 foreign firms produced 75% of manufactured output.
In 2025 wholesale trade produced 19.7% of nominal value added, manufacturing 18.5% and finance and insurance 14.0%, the trade ministry says. Income paid abroad exceeded income received from abroad by S$133 billion, so gross national income was S$656 billion, against GDP of S$790 billion.
Iceland
Population: 398 thousand ·
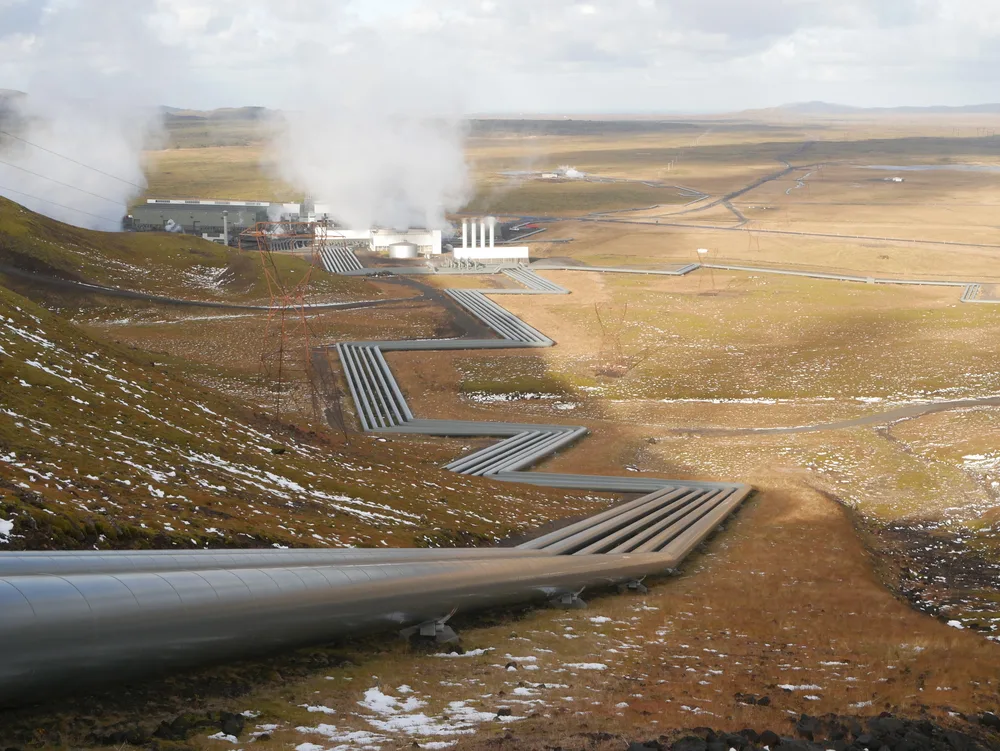
Fishing became a large part of Iceland’s economy after the 1880s. Wartime occupation and Marshall Plan aid then took it from one of Europe’s poorest countries to one of its wealthiest. Abundant hydroelectric and geothermal power later drew aluminium smelting.
Tourism made up 8.8% of GDP in 2025, Statistics Iceland estimates, while marine products and aluminium were 38.9% and 34.5% of goods exports. Eurostat put Icelandic consumer price levels 84% above the EU average in 2025, and warns that unadjusted comparisons overstate output in costly countries.
United States
Population: 342.8 million ·

Rich natural resources and mass production drove rapid expansion in the 19th century. The United States has been the world’s largest economy since around 1890. Growth averaged 3.8% a year in 1946–73.
IMF staff found that output per hour grew 2.7% a year in 2023–25, faster than in other advanced economies. Much of the gain has gone to capital, they note, while labour’s share of income keeps falling. Large technology firms make up around a third of US stock-market value.
Denmark
Population: 6 million ·

Lacking minerals and, until the 1980s, oil and gas, agricultural Denmark always relied on foreign trade. Industrial jobs overtook farm jobs only in the 1950s, and 1958–73 brought unprecedented growth.
Pharmaceuticals, led by Novo Nordisk’s weight-loss drugs, have driven export growth, particularly through Danish-owned production abroad, the European Commission says. The economy ministry notes that pharmaceutical goods made in the United States under Danish ownership never cross the Danish border. Its December 2025 survey described a two-tier economy, with domestic demand flat since the end of 2024.
Netherlands
Population: 18.1 million ·
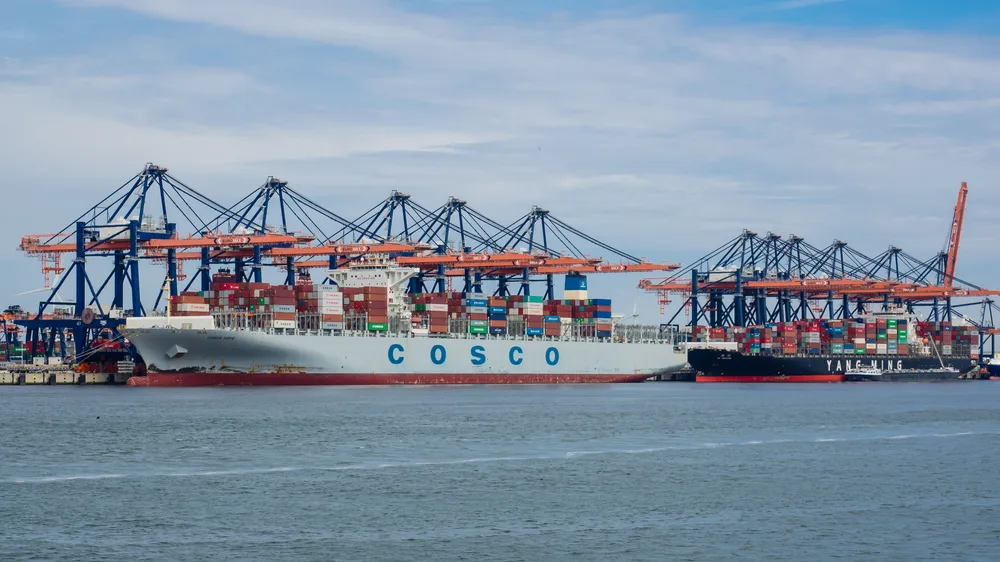
By the mid-17th century the Dutch Republic was Europe’s dominant trading power, with about half of Europe’s merchant shipping in 1670. Industrialisation caught up with Belgium’s by about 1920, with Philips among the leading firms. The Groningen gas field, found in 1959, later brought windfall profits from exports.
Today Rotterdam is Europe’s largest port, while gas production at Groningen ended in 2023. Multinationals, mostly foreign-owned, generated 31% of GDP in 2021, according to Statistics Netherlands (CBS). CBS notes that they accounted for 22% of full-time-equivalent jobs.
The ranking continues: 11–100
IMF · World Economic Outlook (October 2026)
- GDP per capita, 2026: US$77,049.00
- GDP per capita, 2026: US$75,172.00
- GDP per capita, 2026: US$72,441.00
- GDP per capita, 2026: US$70,662.00
- GDP per capita, 2026: US$69,244.00
- GDP per capita, 2026: US$67,020.00
- GDP per capita, 2026: US$65,699.00
- GDP per capita, 2026: US$64,774.00
- GDP per capita, 2026: US$63,634.00
- GDP per capita, 2026: US$61,108.00
- GDP per capita, 2026: US$60,322.00
- GDP per capita, 2026: US$60,156.00
- GDP per capita, 2026: US$60,105.00
- GDP per capita, 2026: US$57,109.00
- GDP per capita, 2026: US$53,988.00
- GDP per capita, 2026: US$52,149.00
- GDP per capita, 2026: US$51,448.00
- GDP per capita, 2026: US$51,043.00
- GDP per capita, 2026: US$45,886.00
- GDP per capita, 2026: US$44,477.00
- GDP per capita, 2026: US$43,951.00
- GDP per capita, 2026: US$43,858.00
- GDP per capita, 2026: US$43,512.00
- GDP per capita, 2026: US$42,934.00
- GDP per capita, 2026: US$41,851.00
- GDP per capita, 2026: US$41,756.00
- GDP per capita, 2026: US$41,631.00
- GDP per capita, 2026: US$40,613.00
- GDP per capita, 2026: US$39,614.00
- GDP per capita, 2026: US$38,572.00
- GDP per capita, 2026: US$37,310.00
- GDP per capita, 2026: US$36,577.00
- GDP per capita, 2026: US$36,135.00
- GDP per capita, 2026: US$35,400.00
- GDP per capita, 2026: US$34,815.00
- GDP per capita, 2026: US$31,186.00
- GDP per capita, 2026: US$30,884.00
- GDP per capita, 2026: US$29,860.00
- GDP per capita, 2026: US$29,413.00
- GDP per capita, 2026: US$28,928.00
- GDP per capita, 2026: US$28,630.00
- GDP per capita, 2026: US$28,245.00
- GDP per capita, 2026: US$28,147.00
- GDP per capita, 2026: US$27,884.00
- GDP per capita, 2026: US$27,339.00
- GDP per capita, 2026: US$24,741.00
- GDP per capita, 2026: US$23,000.00
- GDP per capita, 2026: US$22,504.00
- GDP per capita, 2026: US$22,425.00
- GDP per capita, 2026: US$22,237.00
- GDP per capita, 2026: US$21,308.00
- GDP per capita, 2026: US$21,282.00
- GDP per capita, 2026: US$21,079.00
- GDP per capita, 2026: US$20,877.00
- GDP per capita, 2026: US$19,961.00
- GDP per capita, 2026: US$19,953.00
- GDP per capita, 2026: US$19,507.00
- GDP per capita, 2026: US$19,311.00
- GDP per capita, 2026: US$19,157.00
- GDP per capita, 2026: US$18,603.00
- GDP per capita, 2026: US$17,126.00
- GDP per capita, 2026: US$16,211.00
- GDP per capita, 2026: US$16,191.00
- GDP per capita, 2026: US$16,076.00
- GDP per capita, 2026: US$16,021.00
- GDP per capita, 2026: US$15,981.00
- GDP per capita, 2026: US$15,371.00
- GDP per capita, 2026: US$15,091.00
- GDP per capita, 2026: US$13,968.00
- GDP per capita, 2026: US$13,671.00
- GDP per capita, 2026: US$13,298.00
- GDP per capita, 2026: US$13,245.00
- GDP per capita, 2026: US$12,397.00
- GDP per capita, 2026: US$12,291.00
- GDP per capita, 2026: US$11,963.00
- GDP per capita, 2026: US$11,762.00
- GDP per capita, 2026: US$11,498.00
- GDP per capita, 2026: US$11,404.00
- GDP per capita, 2026: US$11,234.00
- GDP per capita, 2026: US$11,034.00
- GDP per capita, 2026: US$10,845.00
- GDP per capita, 2026: US$10,726.00
- GDP per capita, 2026: US$10,662.00
- GDP per capita, 2026: US$10,428.00
- GDP per capita, 2026: US$9,907.00
- GDP per capita, 2026: US$9,497.00
- GDP per capita, 2026: US$9,085.00
- GDP per capita, 2026: US$8,965.00
- GDP per capita, 2026: US$8,902.00
- GDP per capita, 2026: US$8,674.00
There is always a story.
GDP per capita is a useful measure of output per person and a poor guide, on its own, to how well people live. These are IMF projections for 2026 as captured on 15 October 2026; later editions of the World Economic Outlook will revise them.