Oil and gas reach the customer through a chain of businesses. Some find and produce resources, others transport or process them, and large integrated groups work across several stages. A sector ranking places those different roles on the same page.
The amounts below describe equity value in public markets. They do not measure the value of every barrel underground, a country’s total energy wealth or a company’s annual sales. This is a dated ranking of companies in the source’s oil and gas category.
Reserves are not cash
A resource in the ground still has to be developed, extracted, transported and sold. That process involves costs, time and uncertainty. Multiplying a reserve estimate by today’s commodity price would ignore much of the business between discovery and cash received. Market capitalisation is a different measure, attached to the listed equity.
The same commodity cycle reaches businesses differently
An exploration company and a pipeline operator do not earn money in identical ways. Contracts, operating costs, debt and the mix of activities influence their exposure to changing energy markets. A single sector label should be the start of the comparison, not the end of it.
Ownership can be concentrated
Some large energy groups have substantial government ownership. A listed value can refer to the whole equity base even when only a smaller share trades publicly. This list retains the provider’s figures and entity choices, including its treatment of those ownership structures.
What this snapshot shows
Saudi Aramco leads this captured list at approximately US$1.68tn. The entry at number 100, Antero Resources, is approximately US$11.81bn. The first ten account for 51.4% of the sum of the hundred reported values. That share is calculated within this list; it is not a share of the entire economy.
The first ten
Saudi Aramco
Listing symbol: 2222.SR ·

Saudi Aramco’s operations connect the production of oil and gas with processing, refining and related industrial activity. Based in Dhahran, it is closely tied to Saudi Arabia’s petroleum resources and remains majority state-owned. Its scale comes from operating a vast physical energy system.
The market-capitalisation measure values the company’s shares, including shares that are not freely traded. It should not be confused with the size of the public float, the annual value of oil sold or a direct price for all the oil underground.
Exxon Mobil
Listing symbol: XOM ·
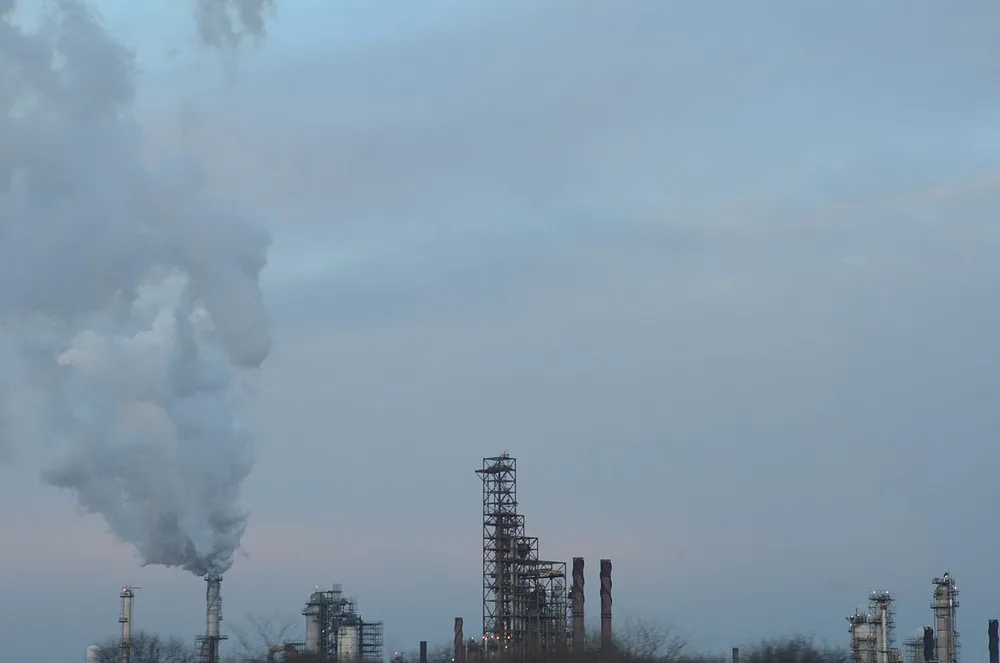
ExxonMobil connects oil and gas production with refining, fuels, lubricants and chemical products. The company’s name reflects the 1999 combination of Exxon and Mobil, two businesses with roots in the earlier Standard Oil system.
Its position is therefore about an integrated industrial business, rather than a single oilfield or petrol-station network. Changes in energy prices can affect its different activities in different ways, while large projects require investment long before their output reaches customers.
Chevron
Listing symbol: CVX ·
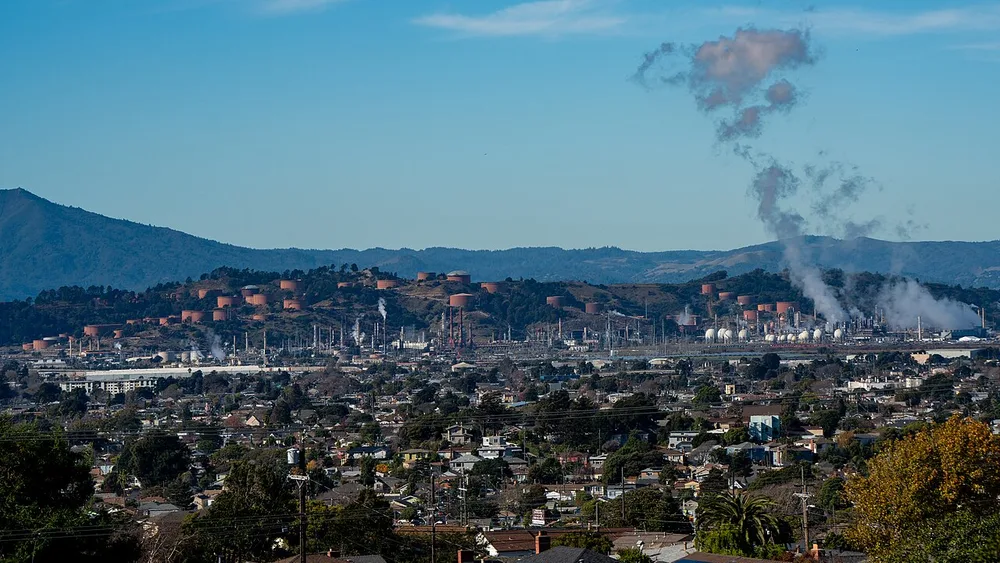
Chevron operates across oil and gas exploration, production, refining and the sale of fuels and other products. Its recognisable retail branding is the customer-facing end of a business that also includes large industrial facilities and projects far from a filling station.
The company’s scale comes from connecting those stages of the energy chain. Its market value is an equity measure of the whole enterprise; it does not represent the replacement cost of every refinery or a fixed valuation of every barrel it may produce.
Shell
Listing symbol: SHEL ·

Shell’s activities span oil, natural gas, liquefied natural gas, refining and customer-facing energy businesses. A driver may know the brand from a filling station, while an industrial customer encounters it through fuel supply, trading or a long-distance gas chain.
That breadth matters when comparing energy companies. The parent’s market capitalisation brings together several businesses whose economics differ, from developing a resource project to moving energy across markets and selling it to the final customer.
PetroChina
Listing symbol: 0857.HK ·

PetroChina is a listed energy company whose operations cover oil and gas production, pipelines, refining and marketing. It sits within the wider corporate structure associated with China National Petroleum Corporation, but the listed company and its parent are distinct entities.
The distinction matters in this ranking: the number concerns the company identified by the source, not every asset associated with the broader state-owned group. Its physical operations connect resource production with the fuels and materials used by industry and consumers.
TotalEnergies
Listing symbol: TTE ·
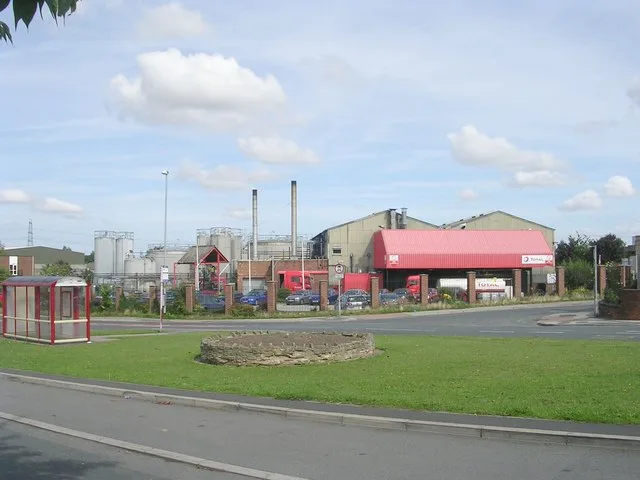
TotalEnergies developed from a petroleum business into a group with operations across oil, gas, refining, chemicals and electricity. Its name signals that broader energy scope, while large industrial projects remain central to the company’s economic footprint.
A refinery, a gas project and an electricity business each have different customers and investment cycles. Their combination helps explain why the parent cannot be reduced to the petrol-station brand a reader might encounter on an ordinary journey.
ConocoPhillips
Listing symbol: COP ·

ConocoPhillips concentrates on finding and producing oil and natural gas. Its modern structure follows the separation of the downstream business into Phillips 66 in 2012, leaving a company more directly focused on exploration and production.
That history helps prevent a common confusion between two similar corporate names. This entry values ConocoPhillips, not Phillips 66, and its business profile differs from an integrated energy group that also owns extensive refining and retail operations.
CNOOC
Listing symbol: 0883.HK ·

CNOOC Limited is a listed oil and gas producer with a strong association with offshore operations. Developing a field at sea requires a combination of geological work, production equipment, transport connections and long-term operating capability.
The company should be distinguished from the broader CNOOC parent group. The market value here belongs to the listed entity identified by the source, making the corporate boundary just as important as the physical scale of the platforms and fields associated with its name.
Petrobras
Listing symbol: PBR ·
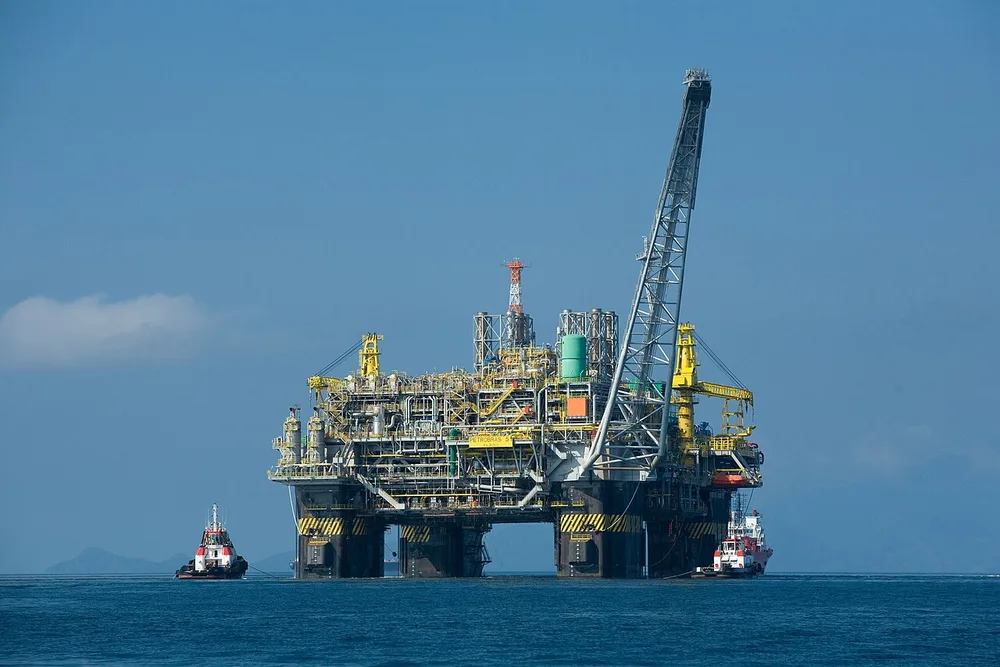
Petrobras is closely connected to Brazil’s offshore oil and gas industry. Its experience in deep-water production makes engineering at sea a central part of the story, alongside refining, transport and other energy activities.
An offshore platform gives a sense of the physical scale involved, but the company’s value also depends on a network of fields, infrastructure and commercial operations. The listed business is the unit being compared here; a photograph of one installation can only show a small part of it.
BP
Listing symbol: BP ·
BP’s operations extend from oil and gas production to refining, trading and customer-facing energy services. The company’s roots reach back to the early twentieth century, while its modern activities connect resource projects with the energy used by businesses and households.
Its market capitalisation gathers those activities into a single equity figure. That figure should not be read as the value of the retail brand alone, or as a simple calculation based on the amount of fuel passing through a filling station.
The ranking continues: 11–100
CompaniesMarketCap · ranking and methodology
- Market capitalisation: US$112,412,639,232.00
- Market capitalisation: US$111,186,952,192.00
- Market capitalisation: US$106,263,166,976.00
- Market capitalisation: US$104,313,020,416.00
- Market capitalisation: US$104,030,609,408.00
- Market capitalisation: US$103,219,306,496.00
- Market capitalisation: US$100,277,141,504.00
- Market capitalisation: US$99,506,710,955.00
- Market capitalisation: US$93,112,033,280.00
- Market capitalisation: US$89,107,750,912.00
- Market capitalisation: US$84,003,667,968.00
- Market capitalisation: US$83,201,073,152.00
- Market capitalisation: US$81,434,161,761.00
- Market capitalisation: US$81,270,693,888.00
- Market capitalisation: US$80,570,277,888.00
- Market capitalisation: US$77,294,624,768.00
- Market capitalisation: US$74,203,103,232.00
- Market capitalisation: US$68,719,116,288.00
- Market capitalisation: US$68,541,116,513.00
- Market capitalisation: US$65,530,990,592.00
- Market capitalisation: US$63,422,771,200.00
- Market capitalisation: US$62,238,605,312.00
- Market capitalisation: US$61,437,710,336.00
- Market capitalisation: US$61,062,950,912.00
- Market capitalisation: US$60,906,319,872.00
- Market capitalisation: US$60,669,276,160.00
- Market capitalisation: US$58,627,330,048.00
- Market capitalisation: US$57,486,716,928.00
- Market capitalisation: US$57,395,654,656.00
- Market capitalisation: US$55,253,000,192.00
- Market capitalisation: US$54,496,051,200.00
- Market capitalisation: US$50,201,281,399.00
- Market capitalisation: US$46,063,656,960.00
- Market capitalisation: US$44,089,977,216.00
- Market capitalisation: US$43,263,043,800.00
- Market capitalisation: US$39,501,467,648.00
- Market capitalisation: US$37,269,972,028.00
- Market capitalisation: US$36,491,067,392.00
- Market capitalisation: US$36,081,953,620.00
- Market capitalisation: US$35,865,079,009.00
- Market capitalisation: US$35,838,731,699.00
- Market capitalisation: US$33,821,650,944.00
- Market capitalisation: US$32,790,067,200.00
- Market capitalisation: US$30,614,558,360.00
- Market capitalisation: US$30,392,664,064.00
- Market capitalisation: US$29,937,827,840.00
- Market capitalisation: US$29,859,393,536.00
- Market capitalisation: US$29,720,621,160.00
- Market capitalisation: US$29,317,575,986.00
- Market capitalisation: US$27,804,145,664.00
- Market capitalisation: US$26,980,056,810.00
- Market capitalisation: US$25,997,086,524.00
- Market capitalisation: US$25,701,761,820.00
- Market capitalisation: US$25,205,577,592.00
- Market capitalisation: US$24,908,054,156.00
- Market capitalisation: US$24,473,922,541.00
- Market capitalisation: US$23,427,356,672.00
- Market capitalisation: US$22,466,204,822.00
- Market capitalisation: US$21,953,505,280.00
- Market capitalisation: US$21,779,769,344.00
- Market capitalisation: US$20,287,978,549.00
- Market capitalisation: US$20,257,949,696.00
- Market capitalisation: US$20,128,666,859.00
- Market capitalisation: US$19,993,517,946.00
- Market capitalisation: US$19,917,107,200.00
- Market capitalisation: US$19,172,210,688.00
- Market capitalisation: US$18,483,248,388.00
- Market capitalisation: US$18,415,284,224.00
- Market capitalisation: US$18,001,583,173.00
- Market capitalisation: US$17,616,654,336.00
- Market capitalisation: US$17,202,107,543.00
- Market capitalisation: US$17,083,565,528.00
- Market capitalisation: US$17,024,745,513.00
- Market capitalisation: US$16,394,431,315.00
- Market capitalisation: US$16,260,298,135.00
- Market capitalisation: US$15,942,458,030.00
- Market capitalisation: US$15,671,223,296.00
- Market capitalisation: US$14,634,103,808.00
- Market capitalisation: US$14,276,463,783.00
- Market capitalisation: US$13,841,029,437.00
- Market capitalisation: US$13,817,419,623.00
- Market capitalisation: US$13,790,014,472.00
- Market capitalisation: US$13,617,354,483.00
- Market capitalisation: US$13,586,404,638.00
- Market capitalisation: US$13,413,207,773.00
- Market capitalisation: US$13,145,691,136.00
- Market capitalisation: US$12,853,249,027.00
- Market capitalisation: US$12,596,159,086.00
- Market capitalisation: US$11,948,558,526.00
- Market capitalisation: US$11,814,881,280.00
There is always a story.
The energy business turns physical resources and infrastructure into commercial activity. These hundred equity values give that activity a market scale, while the different business models explain why a barrel of oil is only part of the story.