Revenue is the simplest measure of a company’s size: the money it takes from customers before paying for anything. By that measure the largest companies include retailers, energy producers, healthcare groups and large technology companies. Many of them are businesses people deal with every day.
This ranking uses CompaniesMarketCap’s list of companies by revenue on 14 October 2026. Each figure covers the trailing twelve months, meaning the most recent twelve months of reported results. It is not tied to a single calendar or financial year.
Sales are not profit
Revenue counts money coming in before the costs of goods, staff, energy, interest and tax. A supermarket chain can sell enormous volumes on a thin margin, while a software company with lower sales may keep a much larger share as profit. The two measures can rank companies very differently.
Big sellers are not always the most valuable
Market capitalisation reflects investors’ view of future profits, not the volume of sales. A company with large revenue and low margins can be worth less than one with smaller sales and higher margins. Compare this list with our market-capitalisation rankings and many positions change.
Exchange rates and accounting
Companies report in their own currencies and under different accounting rules. The source shows results in US dollars, so exchange rates can move a company up or down without any change in its local sales. Some businesses record the full value of goods they trade, which gives a larger revenue figure than recording only a commission.
What this snapshot shows
Amazon leads this captured list at approximately US$742.78bn. The entry at number 100, ENEOS Holdings, is approximately US$94.61bn. The first ten account for 25.2% of the sum of the hundred reported values. That share is calculated within this list; it is not a share of all corporate revenue.
The first ten
Amazon
Listing symbol: AMZN ·
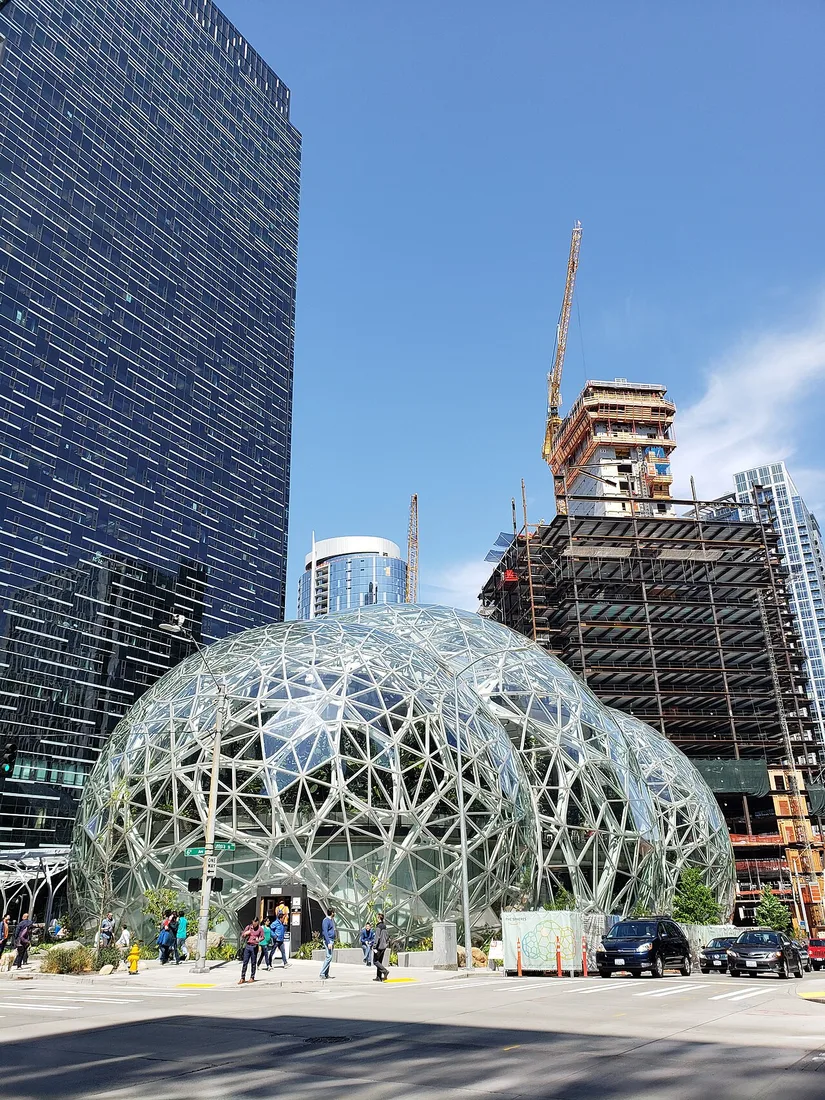
Amazon’s storefront is the most visible part of a business that also supplies cloud computing, advertising, entertainment and logistics. The online bookseller founded in 1994 grew into a marketplace where outside merchants sell alongside Amazon’s own retail operations.
Amazon Web Services adds a different kind of customer relationship: organisations pay for computing infrastructure rather than physical products. That combination is why a retail-sector appearance should not be mistaken for a valuation of the shopping website alone.
Walmart
Listing symbol: WMT ·
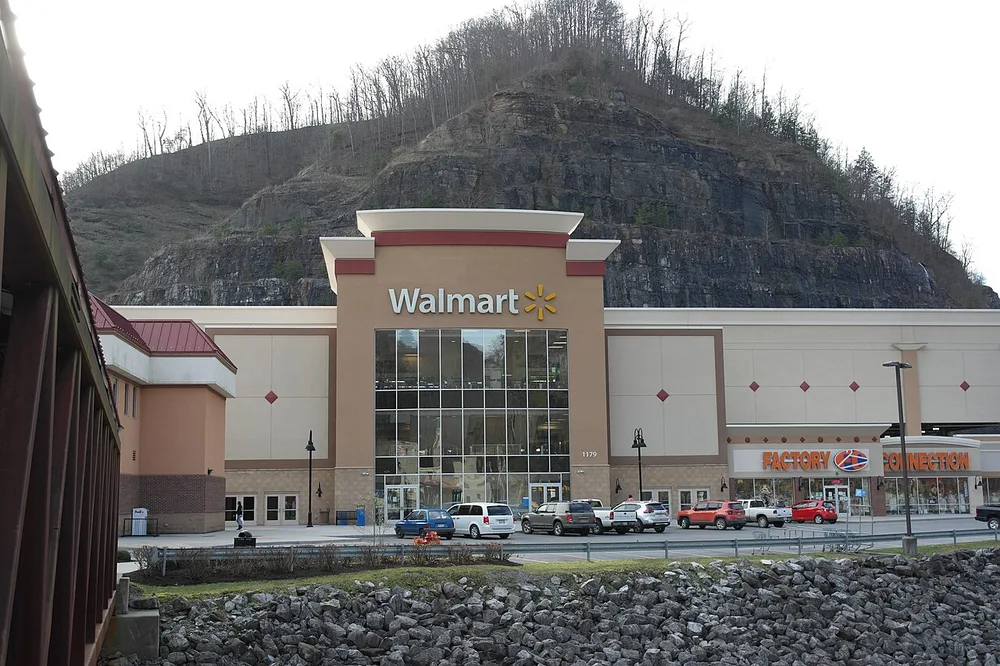
Walmart combines a large store network with online retail and distribution operations. Groceries, household goods and other everyday purchases create frequent customer relationships, while Sam’s Club adds a membership-based warehouse format to the group.
The scale of the logistics behind an ordinary shopping trip is central to the story. The equity value shown here belongs to the parent retailer; it is a different measure from annual sales, which can pass through the business many times over as stock is purchased and sold.
Saudi Aramco
Listing symbol: 2222.SR ·

Saudi Aramco’s operations connect the production of oil and gas with processing, refining and related industrial activity. Based in Dhahran, it is closely tied to Saudi Arabia’s petroleum resources and remains majority state-owned. Its scale comes from operating a vast physical energy system.
The market-capitalisation measure values the company’s shares, including shares that are not freely traded. It should not be confused with the size of the public float, the annual value of oil sold or a direct price for all the oil underground.
Apple
Listing symbol: AAPL ·
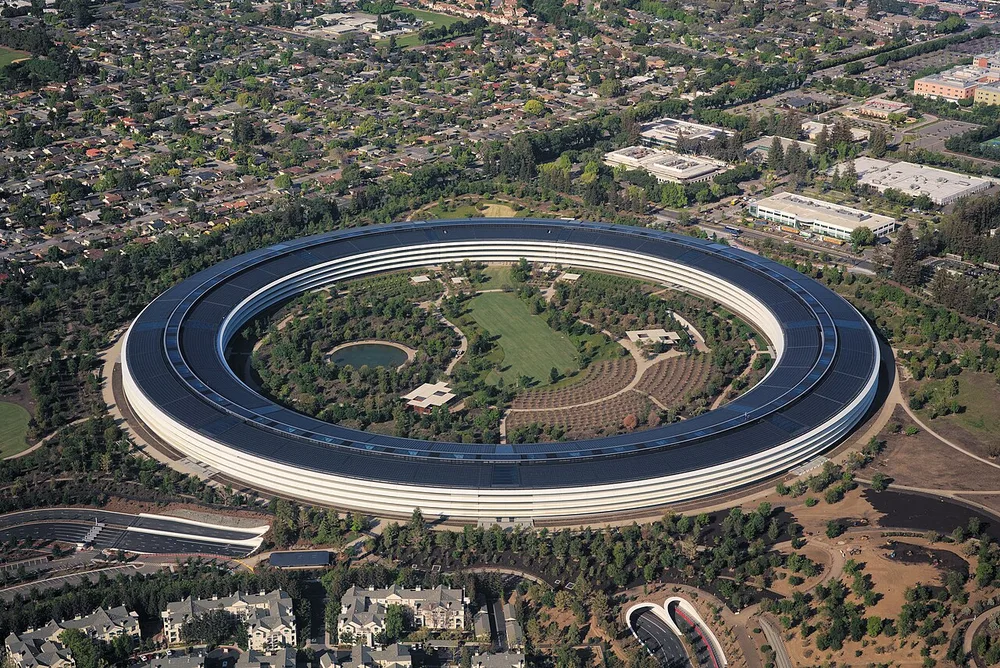
Apple combines hardware, operating systems and services in products intended to work together. The iPhone is its most recognisable example, but Macs, iPads, watches and the services surrounding them extend the relationship beyond a single purchase. The company’s origins in personal computing remain visible in that integration of product and software design.
Its market value prices the whole business, including expectations about future products and services. It is not the retail value of the devices already in customers’ pockets or on their desks.
UnitedHealth
Listing symbol: UNH ·

UnitedHealth Group grew from Charter Med, a Minnesota business founded in 1974 to process doctors’ claims. UnitedHealthcare Corporation was formed in 1977 to buy it, went public in 1984 and became UnitedHealth Group in 1998.
It is now the largest health insurer in the United States. UnitedHealthcare provides health plans for employers, individuals, older people and state programmes. Optum provides care, pharmacy and data services. The group has also faced investigations and lawsuits over billing and claims.
Alphabet (Google)
Listing symbol: GOOG ·
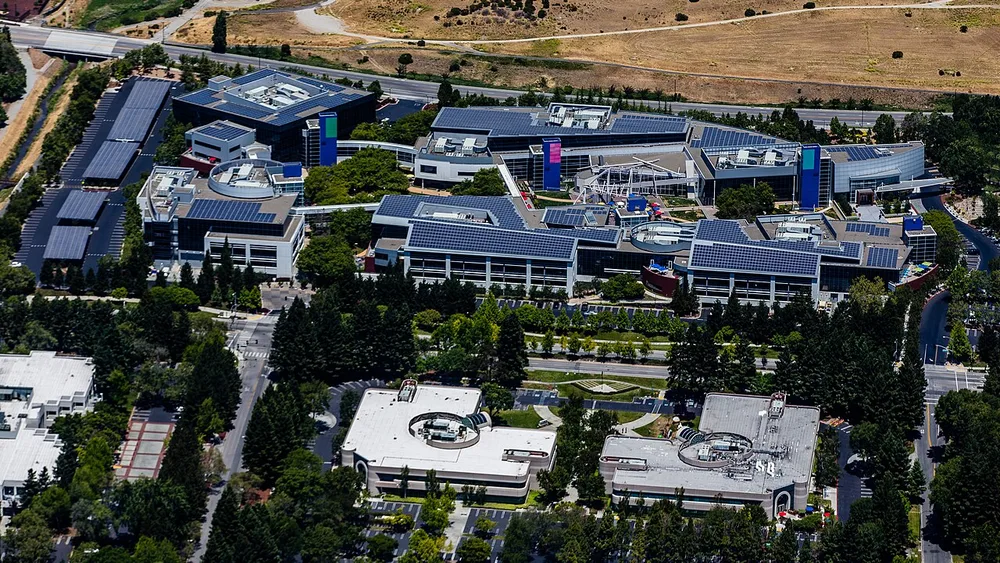
Alphabet was created in 2015 as the parent of Google and a wider collection of businesses. Search and advertising are central to its economic story, while YouTube, Android and cloud services give it several other routes into people’s working and everyday lives.
The listed parent is the unit being valued here. Google’s familiar name helps readers identify the company, but the number represents Alphabet’s equity as a whole, including activities that a user of the search engine may rarely encounter.
Sinopec
Listing symbol: 600028.SS ·
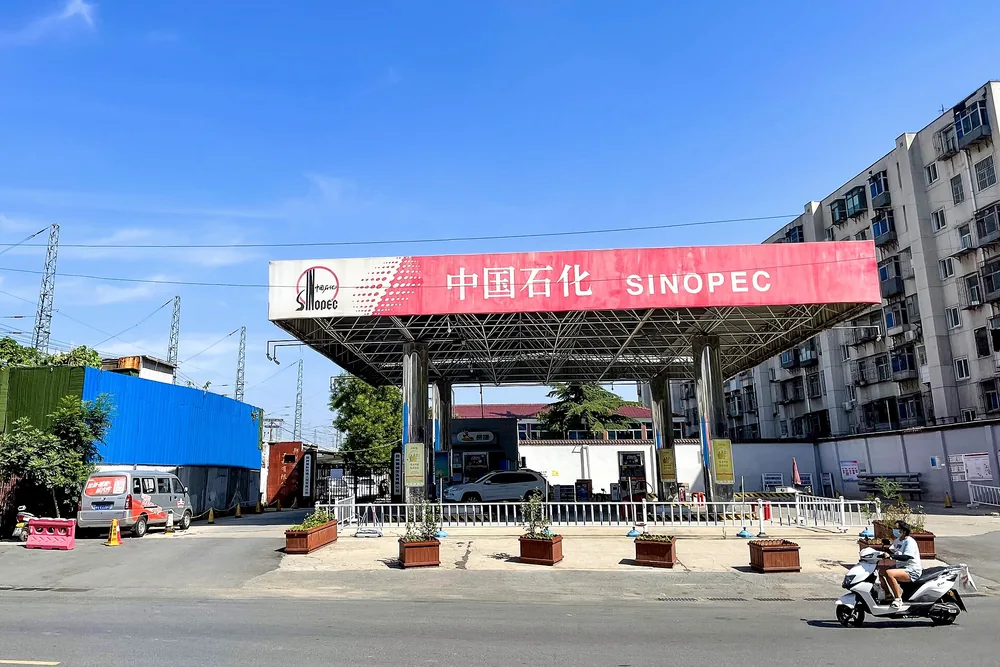
Sinopec’s roots lie in a state petrochemical corporation formed in 1983 from China’s petroleum and chemical ministries. The listed company, China Petroleum & Chemical Corporation, was set up in 2000 by the state-owned Sinopec Group, still its majority shareholder.
Its income comes mainly from refining and marketing oil products and from petrochemicals. It runs China’s largest network of petrol stations and also produces oil and gas. Fuel prices in China are set by the state, which has at times limited its refining profits.
Berkshire Hathaway
Listing symbol: BRK-B ·
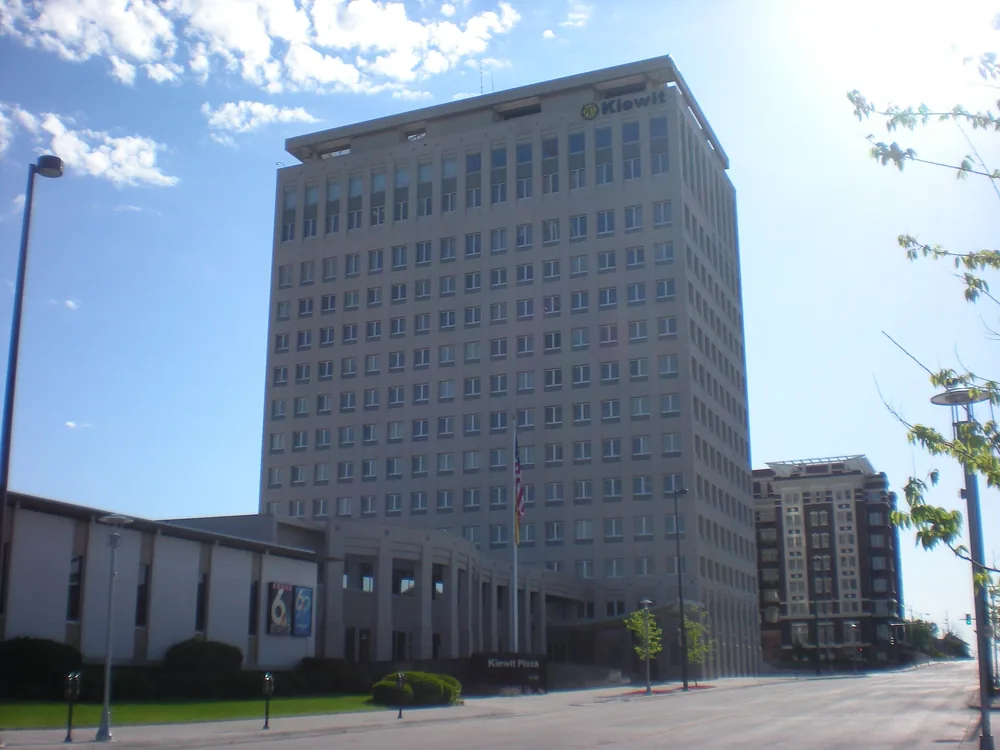
Berkshire Hathaway was a Massachusetts textile maker until Warren Buffett took control in 1965. Its purchase of National Indemnity in 1967 took it into insurance. Premiums held before claims are paid, known as float, became an important source of capital.
The Omaha-based conglomerate now owns businesses including GEICO, BNSF Railway, Berkshire Hathaway Energy and the Pilot truck-stop chain. It also holds a portfolio of minority stakes in listed companies. Greg Abel succeeded Buffett as chief executive at the start of 2026.
PetroChina
Listing symbol: 0857.HK ·
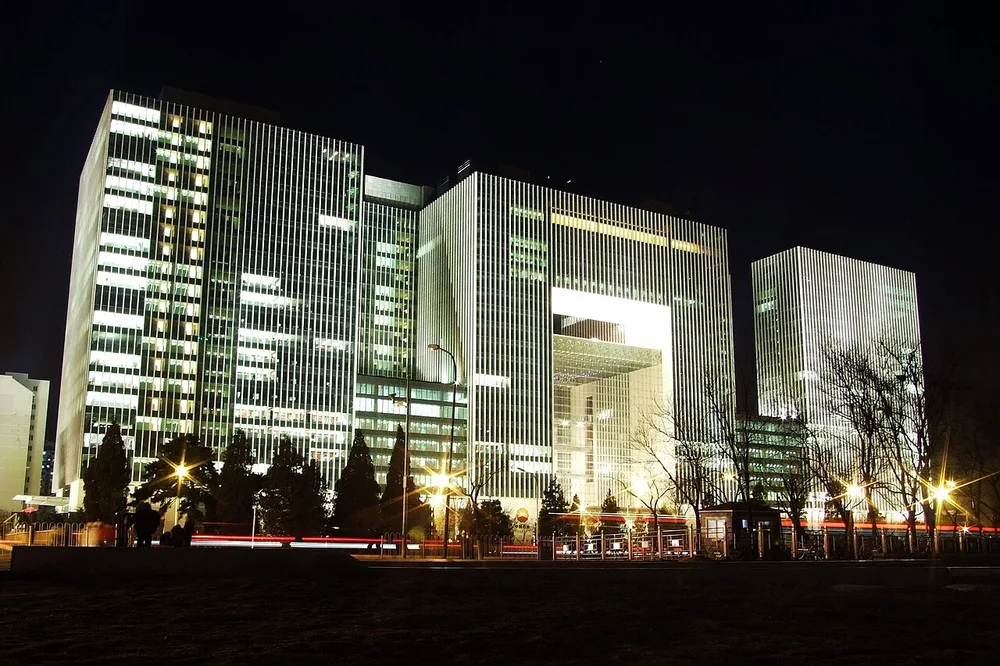
PetroChina is a listed energy company whose operations cover oil and gas production, pipelines, refining and marketing. It sits within the wider corporate structure associated with China National Petroleum Corporation, but the listed company and its parent are distinct entities.
The distinction matters in this ranking: the number concerns the company identified by the source, not every asset associated with the broader state-owned group. Its physical operations connect resource production with the fuels and materials used by industry and consumers.
CVS Health
Listing symbol: CVS ·
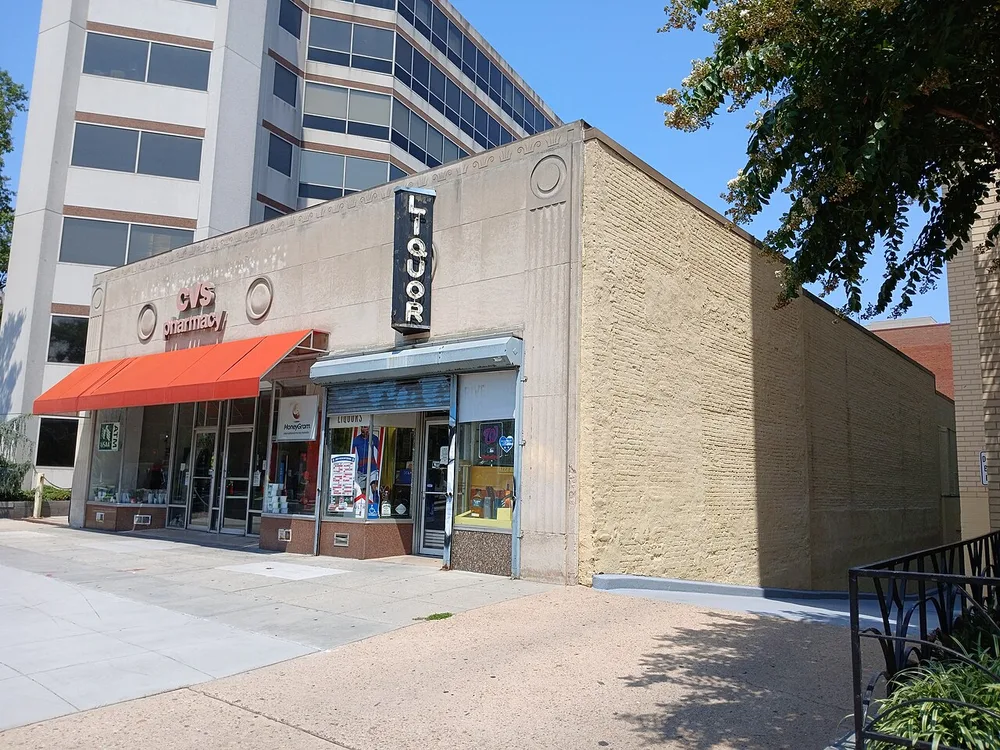
CVS Health includes the CVS Pharmacy retail chain, pharmacy-benefit management through Caremark and health insurance through Aetna. A neighbourhood pharmacy is the most visible part of a business that also operates behind prescriptions and the financing of healthcare.
This breadth explains why its appearance in a retail ranking needs context. The company’s market value does not isolate shop sales; it values a parent whose healthcare activities extend well beyond the counter where a customer collects a prescription.
The ranking continues: 11–100
CompaniesMarketCap · ranking and methodology
- Revenue, trailing twelve months: US$410,983,000,000.00
- Revenue, trailing twelve months: US$374,700,624,687.00
- Revenue, trailing twelve months: US$361,060,000,000.00
- Revenue, trailing twelve months: US$332,771,323,000.00
- Revenue, trailing twelve months: US$332,273,722,835.00
- Revenue, trailing twelve months: US$331,839,000,000.00
- Revenue, trailing twelve months: US$326,389,633,099.00
- Revenue, trailing twelve months: US$302,969,000,000.00
- Revenue, trailing twelve months: US$296,764,925,655.00
- Revenue, trailing twelve months: US$296,601,000,000.00
- Revenue, trailing twelve months: US$294,619,961,870.00
- Revenue, trailing twelve months: US$293,587,000,000.00
- Revenue, trailing twelve months: US$281,336,000,000.00
- Revenue, trailing twelve months: US$254,248,000,000.00
- Revenue, trailing twelve months: US$247,535,000,000.00
- Revenue, trailing twelve months: US$228,247,000,000.00
- Revenue, trailing twelve months: US$223,056,956,184.00
- Revenue, trailing twelve months: US$217,163,000,000.00
- Revenue, trailing twelve months: US$208,711,000,000.00
- Revenue, trailing twelve months: US$202,938,000,000.00
- Revenue, trailing twelve months: US$201,113,000,000.00
- Revenue, trailing twelve months: US$196,382,000,000.00
- Revenue, trailing twelve months: US$190,571,197,000.00
- Revenue, trailing twelve months: US$189,143,468,186.00
- Revenue, trailing twelve months: US$188,429,464,012.00
- Revenue, trailing twelve months: US$187,973,000,000.00
- Revenue, trailing twelve months: US$185,527,000,000.00
- Revenue, trailing twelve months: US$179,635,221,423.00
- Revenue, trailing twelve months: US$169,176,000,000.00
- Revenue, trailing twelve months: US$157,707,200,000.00
- Revenue, trailing twelve months: US$153,577,000,000.00
- Revenue, trailing twelve months: US$152,275,126,592.00
- Revenue, trailing twelve months: US$152,167,000,000.00
- Revenue, trailing twelve months: US$151,823,659,991.00
- Revenue, trailing twelve months: US$151,250,830,640.00
- Revenue, trailing twelve months: US$151,197,000,000.00
- Revenue, trailing twelve months: US$150,854,738,017.00
- Revenue, trailing twelve months: US$150,413,409,191.00
- Revenue, trailing twelve months: US$149,326,000,000.00
- Revenue, trailing twelve months: US$145,679,000,000.00
- Revenue, trailing twelve months: US$144,690,712,494.00
- Revenue, trailing twelve months: US$143,898,911,710.00
- Revenue, trailing twelve months: US$142,724,815,105.00
- Revenue, trailing twelve months: US$139,397,000,000.00
- Revenue, trailing twelve months: US$139,059,017,844.00
- Revenue, trailing twelve months: US$138,895,000,000.00
- Revenue, trailing twelve months: US$138,092,943,668.00
- Revenue, trailing twelve months: US$134,159,645,635.00
- Revenue, trailing twelve months: US$133,676,751,580.00
- Revenue, trailing twelve months: US$129,162,110,781.00
- Revenue, trailing twelve months: US$128,743,944,796.00
- Revenue, trailing twelve months: US$128,210,026,048.00
- Revenue, trailing twelve months: US$127,239,000,000.00
- Revenue, trailing twelve months: US$126,446,271,973.00
- Revenue, trailing twelve months: US$125,628,868,448.00
- Revenue, trailing twelve months: US$124,905,000,000.00
- Revenue, trailing twelve months: US$121,992,491,429.00
- Revenue, trailing twelve months: US$121,914,702,433.00
- Revenue, trailing twelve months: US$119,019,499,326.00
- Revenue, trailing twelve months: US$116,983,000,000.00
- Revenue, trailing twelve months: US$113,652,000,000.00
- Revenue, trailing twelve months: US$113,534,166,189.00
- Revenue, trailing twelve months: US$112,456,660,554.00
- Revenue, trailing twelve months: US$110,286,905,503.00
- Revenue, trailing twelve months: US$107,705,000,000.00
- Revenue, trailing twelve months: US$107,432,182,883.00
- Revenue, trailing twelve months: US$107,379,000,000.00
- Revenue, trailing twelve months: US$106,214,648,370.00
- Revenue, trailing twelve months: US$104,333,011,714.00
- Revenue, trailing twelve months: US$104,175,197,266.00
- Revenue, trailing twelve months: US$104,150,457,645.00
- Revenue, trailing twelve months: US$103,619,000,000.00
- Revenue, trailing twelve months: US$99,659,103,529.00
- Revenue, trailing twelve months: US$98,903,784,893.00
- Revenue, trailing twelve months: US$98,861,000,000.00
- Revenue, trailing twelve months: US$98,705,447,649.00
- Revenue, trailing twelve months: US$98,663,240,388.00
- Revenue, trailing twelve months: US$98,484,046,041.00
- Revenue, trailing twelve months: US$97,929,000,000.00
- Revenue, trailing twelve months: US$96,904,000,000.00
- Revenue, trailing twelve months: US$96,568,824,993.00
- Revenue, trailing twelve months: US$96,353,343,566.00
- Revenue, trailing twelve months: US$95,822,263,631.00
- Revenue, trailing twelve months: US$95,641,403,508.00
- Revenue, trailing twelve months: US$94,926,343,761.00
- Revenue, trailing twelve months: US$94,926,343,761.00
- Revenue, trailing twelve months: US$94,836,151,439.00
- Revenue, trailing twelve months: US$94,720,000,000.00
- Revenue, trailing twelve months: US$94,609,221,379.00
There is always a story.
The largest companies by revenue are the ones through which the most money flows. That makes this list a useful measure of commercial scale on 14 October 2026, and a poor guide on its own to profit or value.