Profit is what remains after a company has paid for what it sells and how it operates. This list ranks companies by one version of that figure: earnings before income tax over the most recent twelve months of reported results. It favours businesses that combine large sales with high margins.
The ranking uses CompaniesMarketCap’s list of the most profitable companies on 14 October 2026. The source defines earnings as pretax income. That is an accounting result for the whole company; it is not the dividend paid to shareholders or the cash the business generated in the same period.
Why rank before tax
Tax rates differ between countries and can change a company’s net profit for reasons unrelated to its business. Ranking before income tax removes that difference. It does not remove others, such as accounting rules or the currency in which a company reports.
One-off items still count
Pretax income can include gains from selling a business, changes in the value of investments and other unusual items. A company with large investment portfolios can see its earnings rise or fall with financial markets. A single good or bad year can therefore move a company sharply in this list.
Profit, revenue and value
The largest companies by revenue are not always the most profitable, and the most profitable are not always the most valuable. Market capitalisation adds investors’ expectations about the future, while earnings describe the recent past. Reading this list beside our revenue and market-value rankings shows where those measures agree and where they part company.
What this snapshot shows
Alphabet (Google) leads this captured list at approximately US$301.52bn. The entry at number 100, Pepsico, is approximately US$14.28bn. The first ten account for 41.3% of the sum of the hundred reported values. That share is calculated within this list; it is not a share of all corporate profit.
The first ten
Alphabet (Google)
Listing symbol: GOOG ·
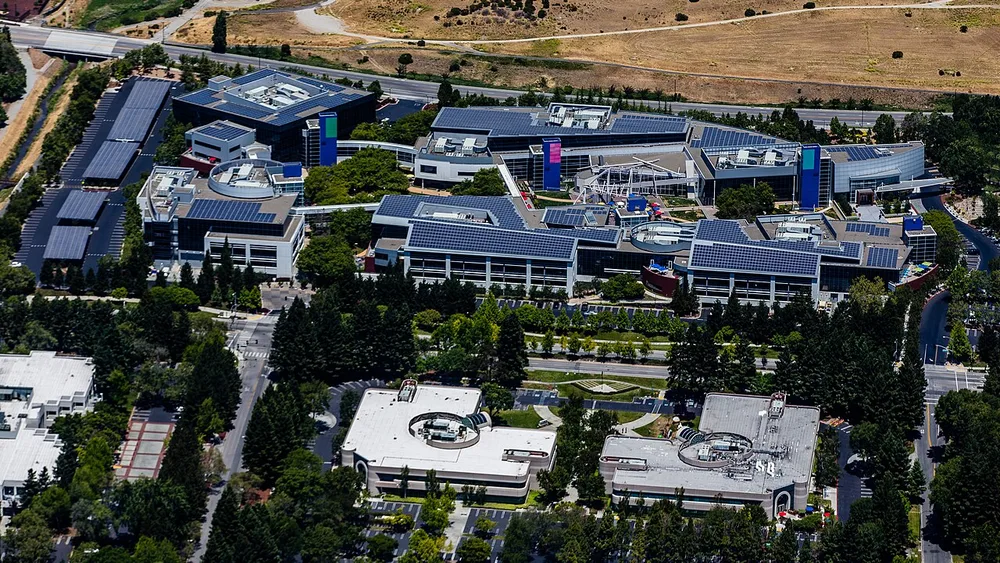
Alphabet was created in 2015 as the parent of Google and a wider collection of businesses. Search and advertising are central to its economic story, while YouTube, Android and cloud services give it several other routes into people’s working and everyday lives.
The listed parent is the unit being valued here. Google’s familiar name helps readers identify the company, but the number represents Alphabet’s equity as a whole, including activities that a user of the search engine may rarely encounter.
NVIDIA
Listing symbol: NVDA ·
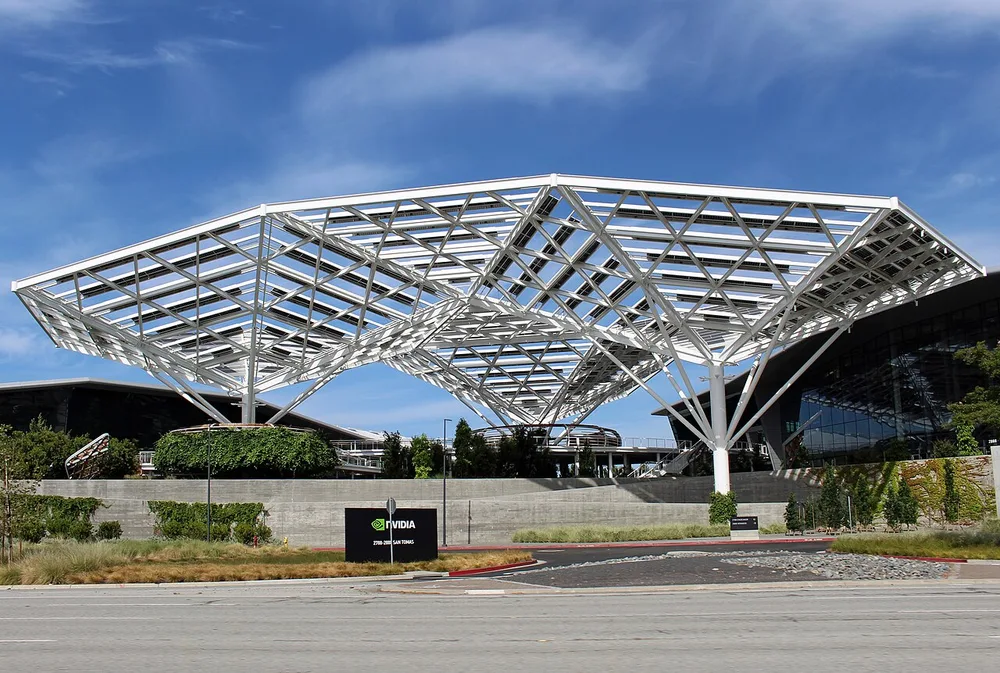
NVIDIA made its name by supplying the graphics processors that draw game worlds. The same ability to perform many calculations in parallel opened a much larger role in scientific computing and artificial intelligence. Its business now connects chips, networking, complete computing systems and the software used to work with them.
The striking part of its position is that much of this technology sits inside another organisation’s infrastructure. A consumer may never buy an NVIDIA-branded device yet still use services running on its processors.
Saudi Aramco
Listing symbol: 2222.SR ·

Saudi Aramco’s operations connect the production of oil and gas with processing, refining and related industrial activity. Based in Dhahran, it is closely tied to Saudi Arabia’s petroleum resources and remains majority state-owned. Its scale comes from operating a vast physical energy system.
The market-capitalisation measure values the company’s shares, including shares that are not freely traded. It should not be confused with the size of the public float, the annual value of oil sold or a direct price for all the oil underground.
Microsoft
Listing symbol: MSFT ·
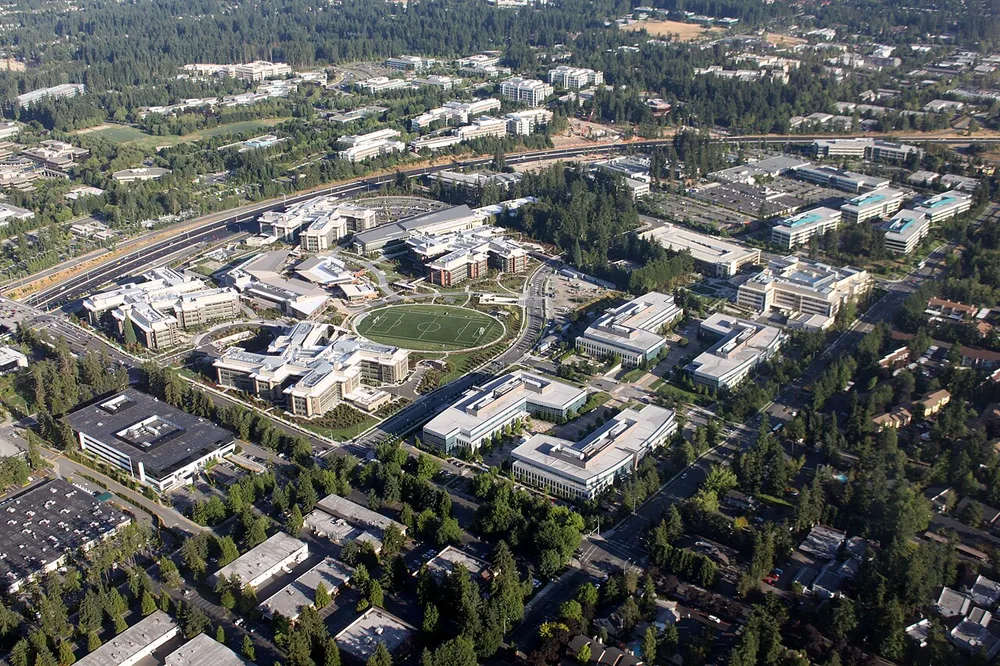
Microsoft’s history runs from software for early personal computers to the infrastructure of modern offices and data centres. Windows and Office made the brand familiar, while Azure, business applications, developer tools and gaming expanded its reach into other settings.
Its place in the ranking reflects that combination of established software relationships and newer computing demand. A company can buy Microsoft services throughout its organisation, from an employee’s desktop to the systems delivering its own products to customers.
Apple
Listing symbol: AAPL ·
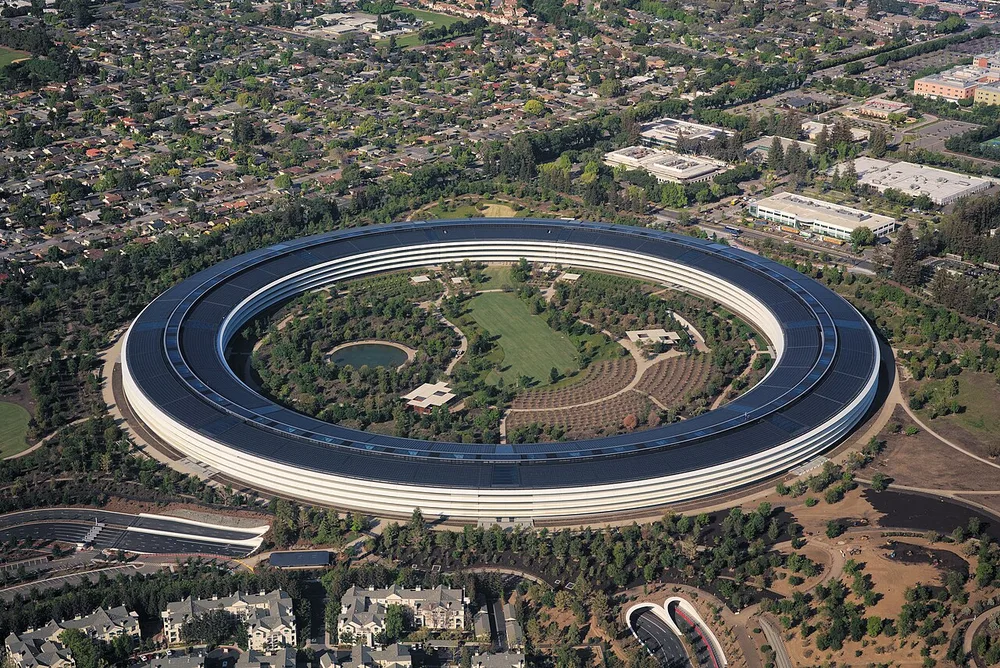
Apple combines hardware, operating systems and services in products intended to work together. The iPhone is its most recognisable example, but Macs, iPads, watches and the services surrounding them extend the relationship beyond a single purchase. The company’s origins in personal computing remain visible in that integration of product and software design.
Its market value prices the whole business, including expectations about future products and services. It is not the retail value of the devices already in customers’ pockets or on their desks.
SK Hynix
Listing symbol: 000660.KS ·
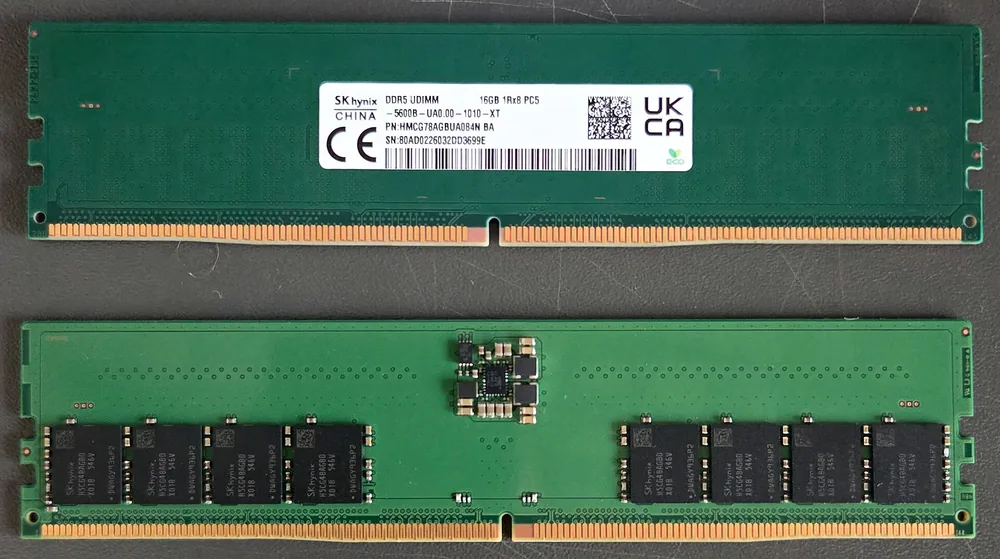
SK Hynix makes memory chips, chiefly DRAM and NAND flash, and is one of the three big memory manufacturers. It began in 1983 as Hyundai Electronics and acquired LG Semicon in 1998. It took the Hynix name in 2001 and joined South Korea’s SK Group in 2012.
Its customers include Nvidia, Microsoft and Apple. It supplies high-bandwidth memory (HBM) for artificial-intelligence computing, including HBM3E chips for Nvidia. In 2024 it said it had begun the world’s first mass production of 12-layer HBM chips.
Samsung
Listing symbol: 005930.KS ·
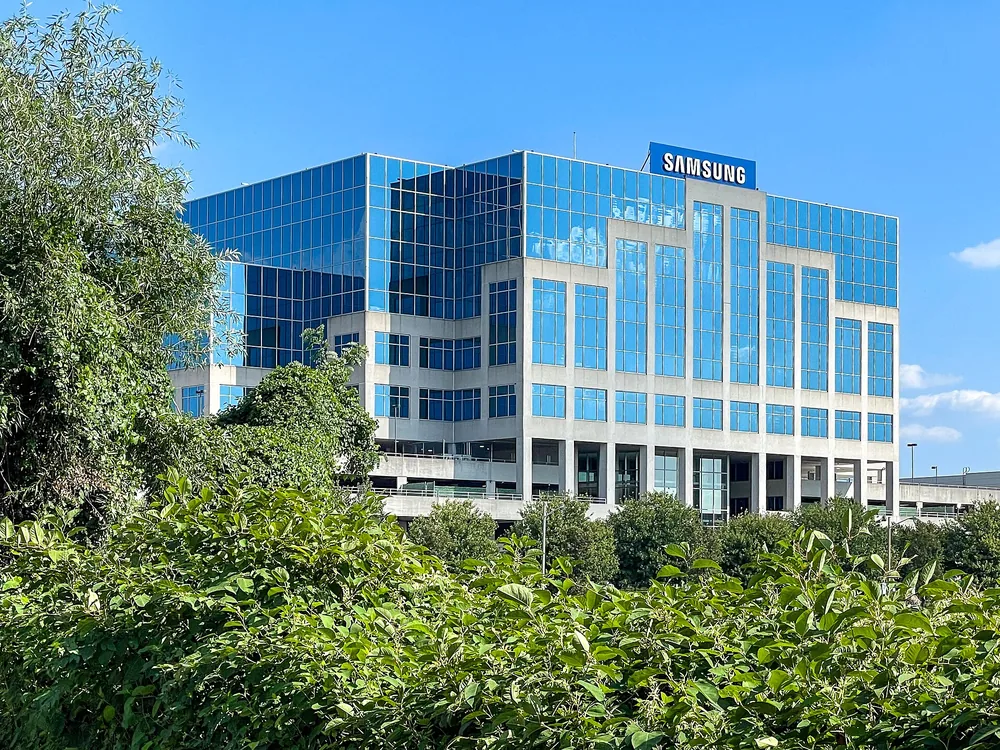
Samsung Electronics is the flagship listed company of South Korea’s Samsung group. Founded in Suwon in 1969, it is best known for its Galaxy smartphones. It has been the world’s largest television maker by revenue every year since 2006.
Part of the business works behind other brands. Samsung declared its intention to make DRAM memory chips in 1983 and is now one of the world’s largest manufacturers of semiconductor memory. It also supplies image sensors, camera modules and display panels to other manufacturers, including Apple.
Amazon
Listing symbol: AMZN ·

Amazon’s storefront is the most visible part of a business that also supplies cloud computing, advertising, entertainment and logistics. The online bookseller founded in 1994 grew into a marketplace where outside merchants sell alongside Amazon’s own retail operations.
Amazon Web Services adds a different kind of customer relationship: organisations pay for computing infrastructure rather than physical products. That combination is why a retail-sector appearance should not be mistaken for a valuation of the shopping website alone.
Meta Platforms (Facebook)
Listing symbol: META ·
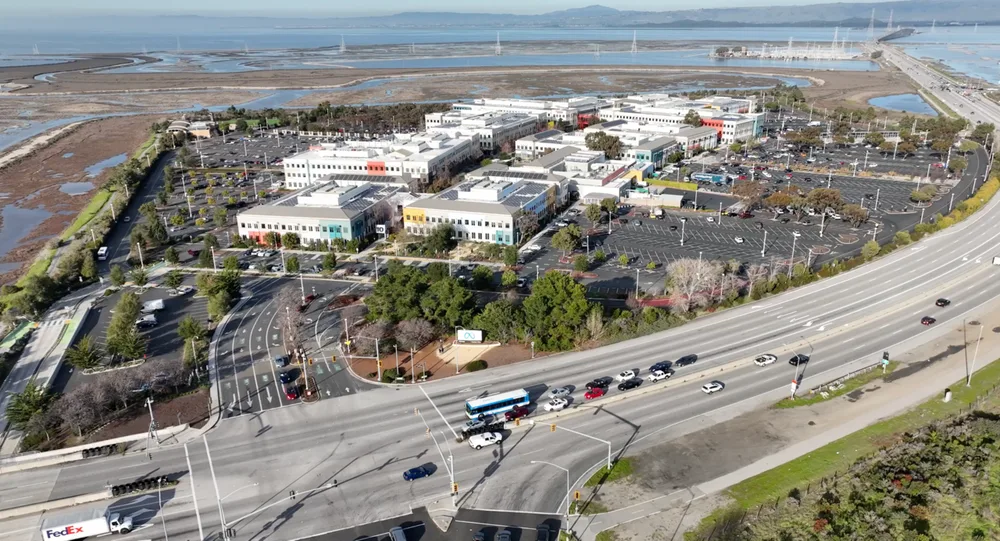
Meta brings Facebook, Instagram, WhatsApp and other communication services under one parent. The company’s advertising business links the attention of users with organisations trying to reach them. Those services differ in format, but their scale gives the group several ways to build and maintain an audience.
Its spending on artificial intelligence and immersive computing sits alongside that established business. The valuation belongs to the parent company, so the ranking does not assign a separate market price to each individual app.
Berkshire Hathaway
Listing symbol: BRK-B ·

Berkshire Hathaway was a Massachusetts textile maker until Warren Buffett took control in 1965. Its purchase of National Indemnity in 1967 took it into insurance. Premiums held before claims are paid, known as float, became an important source of capital.
The Omaha-based conglomerate now owns businesses including GEICO, BNSF Railway, Berkshire Hathaway Energy and the Pilot truck-stop chain. It also holds a portfolio of minority stakes in listed companies. Greg Abel succeeded Buffett as chief executive at the start of 2026.
The ranking continues: 11–100
CompaniesMarketCap · ranking and methodology
- Pretax earnings, trailing twelve months: US$65,346,300,000.00
- Pretax earnings, trailing twelve months: US$59,688,100,000.00
- Pretax earnings, trailing twelve months: US$59,294,000,000.00
- Pretax earnings, trailing twelve months: US$54,347,000,000.00
- Pretax earnings, trailing twelve months: US$49,687,900,000.00
- Pretax earnings, trailing twelve months: US$45,354,000,000.00
- Pretax earnings, trailing twelve months: US$44,833,900,000.00
- Pretax earnings, trailing twelve months: US$43,585,000,000.00
- Pretax earnings, trailing twelve months: US$40,963,000,000.00
- Pretax earnings, trailing twelve months: US$39,904,000,000.00
- Pretax earnings, trailing twelve months: US$39,485,800,000.00
- Pretax earnings, trailing twelve months: US$37,794,100,000.00
- Pretax earnings, trailing twelve months: US$37,654,100,000.00
- Pretax earnings, trailing twelve months: US$36,150,700,000.00
- Pretax earnings, trailing twelve months: US$33,595,600,000.00
- Pretax earnings, trailing twelve months: US$33,209,000,000.00
- Pretax earnings, trailing twelve months: US$32,334,800,000.00
- Pretax earnings, trailing twelve months: US$32,071,000,000.00
- Pretax earnings, trailing twelve months: US$31,917,000,000.00
- Pretax earnings, trailing twelve months: US$31,671,000,000.00
- Pretax earnings, trailing twelve months: US$29,799,000,000.00
- Pretax earnings, trailing twelve months: US$27,463,000,000.00
- Pretax earnings, trailing twelve months: US$26,956,000,000.00
- Pretax earnings, trailing twelve months: US$26,838,000,000.00
- Pretax earnings, trailing twelve months: US$26,407,200,000.00
- Pretax earnings, trailing twelve months: US$26,208,000,000.00
- Pretax earnings, trailing twelve months: US$26,147,000,000.00
- Pretax earnings, trailing twelve months: US$26,138,000,000.00
- Pretax earnings, trailing twelve months: US$25,770,600,000.00
- Pretax earnings, trailing twelve months: US$24,707,000,000.00
- Pretax earnings, trailing twelve months: US$24,522,000,000.00
- Pretax earnings, trailing twelve months: US$24,321,400,000.00
- Pretax earnings, trailing twelve months: US$23,764,300,000.00
- Pretax earnings, trailing twelve months: US$23,220,900,000.00
- Pretax earnings, trailing twelve months: US$23,071,300,000.00
- Pretax earnings, trailing twelve months: US$22,749,900,000.00
- Pretax earnings, trailing twelve months: US$22,694,800,000.00
- Pretax earnings, trailing twelve months: US$22,691,000,000.00
- Pretax earnings, trailing twelve months: US$22,576,000,000.00
- Pretax earnings, trailing twelve months: US$22,304,800,000.00
- Pretax earnings, trailing twelve months: US$22,024,500,000.00
- Pretax earnings, trailing twelve months: US$21,847,000,000.00
- Pretax earnings, trailing twelve months: US$21,828,400,000.00
- Pretax earnings, trailing twelve months: US$21,648,000,000.00
- Pretax earnings, trailing twelve months: US$21,438,700,000.00
- Pretax earnings, trailing twelve months: US$21,253,000,000.00
- Pretax earnings, trailing twelve months: US$21,163,000,000.00
- Pretax earnings, trailing twelve months: US$21,084,500,000.00
- Pretax earnings, trailing twelve months: US$20,605,100,000.00
- Pretax earnings, trailing twelve months: US$20,457,900,000.00
- Pretax earnings, trailing twelve months: US$20,173,000,000.00
- Pretax earnings, trailing twelve months: US$20,171,900,000.00
- Pretax earnings, trailing twelve months: US$20,111,100,000.00
- Pretax earnings, trailing twelve months: US$19,616,800,000.00
- Pretax earnings, trailing twelve months: US$19,615,600,000.00
- Pretax earnings, trailing twelve months: US$18,857,000,000.00
- Pretax earnings, trailing twelve months: US$18,797,000,000.00
- Pretax earnings, trailing twelve months: US$18,217,000,000.00
- Pretax earnings, trailing twelve months: US$18,176,900,000.00
- Pretax earnings, trailing twelve months: US$17,847,000,000.00
- Pretax earnings, trailing twelve months: US$17,634,700,000.00
- Pretax earnings, trailing twelve months: US$17,479,000,000.00
- Pretax earnings, trailing twelve months: US$17,440,000,000.00
- Pretax earnings, trailing twelve months: US$17,377,000,000.00
- Pretax earnings, trailing twelve months: US$17,340,300,000.00
- Pretax earnings, trailing twelve months: US$16,667,000,000.00
- Pretax earnings, trailing twelve months: US$16,583,300,000.00
- Pretax earnings, trailing twelve months: US$16,397,000,000.00
- Pretax earnings, trailing twelve months: US$16,187,200,000.00
- Pretax earnings, trailing twelve months: US$16,119,700,000.00
- Pretax earnings, trailing twelve months: US$15,995,100,000.00
- Pretax earnings, trailing twelve months: US$15,826,700,000.00
- Pretax earnings, trailing twelve months: US$15,652,900,000.00
- Pretax earnings, trailing twelve months: US$15,634,000,000.00
- Pretax earnings, trailing twelve months: US$15,522,000,000.00
- Pretax earnings, trailing twelve months: US$15,450,500,000.00
- Pretax earnings, trailing twelve months: US$15,370,000,000.00
- Pretax earnings, trailing twelve months: US$15,077,000,000.00
- Pretax earnings, trailing twelve months: US$14,764,000,000.00
- Pretax earnings, trailing twelve months: US$14,618,000,000.00
- Pretax earnings, trailing twelve months: US$14,616,200,000.00
- Pretax earnings, trailing twelve months: US$14,605,000,000.00
- Pretax earnings, trailing twelve months: US$14,545,000,000.00
- Pretax earnings, trailing twelve months: US$14,526,900,000.00
- Pretax earnings, trailing twelve months: US$14,451,000,000.00
- Pretax earnings, trailing twelve months: US$14,332,000,000.00
- Pretax earnings, trailing twelve months: US$14,296,000,000.00
- Pretax earnings, trailing twelve months: US$14,281,000,000.00
- Pretax earnings, trailing twelve months: US$14,281,000,000.00
There is always a story.
These hundred companies reported the largest pretax earnings in their most recent twelve months, as captured on 14 October 2026. Earnings change with every set of results, so the list records recent profitability rather than a permanent order.